 | And Pollution
Reports
Review key findings and links to major global reports over the last 10+ years regarding pollution and waste.
![]()
![]()
![]()
![]()
![]()
![]()
![]()
![]()
![]()
![]()
💨 Air
American Lung Association: The State of the Air (2026)
The “State of the Air” 2026 report finds that even after decades of successful efforts to reduce sources of air pollution, 44% of Americans—152 3 million people—are living in places that get failing grades for unhealthy levels of ozone or particle pollution We found that nearly half of the children in America (46%, or 33 5 million people under the age of 18) live in counties that received a failing grade for at least one measure of air pollution Ten percent of children (7 3 million people under age 18) live in counties with failing grades for all three measures Infants, children and teens are especially vulnerable to the health harms of breathing air pollution Their lungs are still developing, they breathe more air for their body size than adults, and they frequently spend more time outdoors Although particle pollution showed some improvement relative to its decade-long worsening trend, populations exposed to high levels remained much higher than historic lows Meanwhile, unhealthy levels of ozone pollution impacted more people than in the previous five reports This year’s report shows that air pollution results were mixed across the country and across pollutants, highlighting the complex nature of air pollution and the need for regional, state and local attention on pollution sources Visit source. View report.
CCAC: Clean Air and Climate Solutions for ASEAN (2025)
Today over 85 per cent of the ASEAN population are exposed to levels of air pollution exceeding the 2021 WHO air quality guidelines for PM2.5 (5 µg/m3), and 15 per cent to levels above the WHO Interim Target 1 levels (35 µg/m3)—levels that are higher than most national legislation in ASEAN (World Health Organization…Most of the population of ASEAN will not experience improvements in air quality over the next decade as expected levels of economic growth and increasing urbanization will offset gains from stronger energy efficiency, clean cooking as well as air pollution policies…Much of the reduction of particulate matter (PM) exposure would come from measures targeting reductions in “usual suspect” sources such as transport, power, and industry…Sectors and sources that are often outside the purview of air pollution regulation have untapped potential and could deliver the widest range of sustainable development benefits. Visit source. View report.
SOGA: Trends in Health Quality and Health Impact: Insights from Central, South, and Southeast Asia (2025)
Air pollution is the leading environmental risk factor for poor health in Asia, affecting many millions of people across the continent. Countries including India, Pakistan, Thailand, and Viet Nam experience some of the worst air quality episodes globally, putting a spotlight on local and regional air pollution. A clear case in point is the recurrence of air quality episodes in parts of Asia in October and November 2024. Cities including Lahore (Pakistan), Delhi (India) and Ust-Kamenogorsk (Kazakhstan) experienced poor air quality, resulting in shutdown of schools, and disruption to residents’ daily activities. Residents across Central, South, and Southeast Asia are routinely exposed to levels of air pollution above the health-based guidelines set by the World Health Organization (WHO), resulting not only in significant adverse health impacts but also a lower quality of life. In 2021, exposure to air pollution was among the leading risk factors for death and disability across these regions, contributing to more than 3.4 million deaths…Yet there is limited funding for improving air quality across the region. Overall, only 1% of the international development funding was allocated for outdoor air pollution. Despite significant health and economic impacts, development funding remains low for most countries in the region. Recent estimates from the Clean Air Fund have shown that between 2018 and 2022, around 70% of the total international development funding for outdoor air pollution was concentrated in three Asian countries: the Philippines (30%), Bangladesh (23%), and China (19%). In addition, philanthropic funding for air quality is notably low in parts of Asia, apart from China and India. Visit source. View report.
World Bank: Accelerating Access to Clean Air for a Livable Planet (2025)
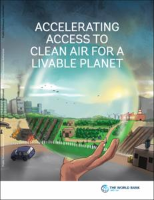
Ambient (outdoor) air pollution accounted for more than 5.7 million deaths globally in 20202 and remains a leading risk factor for premature death, with corresponding economic damages estimated at between US$4.5 trillion and US$6.1 trillion a year—equivalent to between 4.7 percent and 6.5 percent of global GDP…Ninety-nine percent of the world’s population is exposed to unhealthy levels of air pollution that exceed World Health Organization (WHO) air quality guideline levels. However, low- and middle-income countries face the highest burden (WHO, 2022)…Poverty and inequality compound the health burden caused by being exposed to high levels of air pollution…Globally, most PM2.5 air pollution stems from anthropogenic sources…Over the next 15 years, existing and currently planned policies are expected to lead to considerably higher, and more unevenly distributed, exposure to air pollution…Implementing an integrated approach—an approach that combines conventional air quality management measures with energy and climate policies aimed at achieving other goals such as energy independence and reducing greenhouse gas emissions, which often leads to using less fossil fuel and so results in lower air pollution—could halve the number of people exposed to PM2.5 concentrations in excess of 25 μg/m³ with significant health benefits. Visit source. View report.
UNEP: Global Nitrous Oxide Assessment (2024)
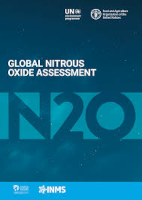
Nitrous oxide, considered to be a super pollutant, is the third most important greenhouse gas and the most significant ozone-layer depleting substance emitted today. Its human-induced emissions, which primarily originate from the agricultural use of synthetic fertilisers and manure, are increasing faster than previously projected. This Assessment identifies abatement measures available today that could reduce these emissions by more than 40 per cent below current levels. Transformations in food production and societal systems could lead to even deeper reductions. Nitrous oxide is part of the nitrogen cycle – nitrogen is essential to all life on Earth and the global food system. The abatement of its anthropogenic emissions must be grounded in a sustainable nitrogen management approach which would also reduce the loss of other nitrogen compounds to the environment…These anthropogenic emissions have increased globally by 40 per cent since 1980, with approximately 75 per cent originating from the agricultural use of synthetic fertilisers and manure. This Assessment projects that, without abatement, global anthropogenic nitrous oxide emissions will increase by approximately 30 per cent over 2020 levels by 2050. Visit source. View report.
SOGA: State of Global Air (2024)
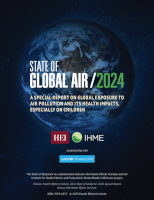
Most people on Earth are exposed to unhealthy levels of air pollution. Each year, millions of people die early, and many more live with debilitating chronic diseases because of breathing polluted air. The threat of air pollution is not new, but it is changing. Air pollution has contributed to death and disease and has hurt economic prospects and community resilience for decades. During that time, policies and technologies have succeeded in drastically improving air quality in some areas, saving lives, and proving that pollution is not an inevitable byproduct of economic development. Yet despite this encouraging progress, the threats posed by air pollution have continued to mount as they merge with the threats posed by global climate change and increasingly aging populations. Visit source. View report.
CCAC: Integrated Assessment of Air Pollution and Climate Change for Sustainable Development In Africa (2023)
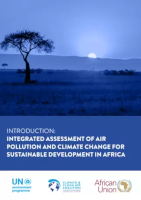
Air pollutants are dangerous for the environment and deadly for human health. Often, air pollution shares the same drivers and sources as greenhouse gases, and their impacts can exacerbate each other. Many vulnerable groups in Africa and around the world are most at risk from the health impacts of air pollution compounded by climate change Without changes in policy, greenhouse gas emissions will triple by 2063. Outdoor air pollution is projected to get worse, causing about 930,000 premature deaths per year in 2030 and about 1.6 million premature deaths per year in 2063. Despite advances in clean cooking technologies, household air pollution would still cause about 170,000 premature deaths per year in 2030 (150,000 by 2063.) Without action, economic growth compounded by population growth, unplanned urbanization, and unsustainable lifestyles will exacerbate pressures on resources, the environment, and human health, and could increase inequalities and limit Africa’s ability to achieve sustainable development. Visit source. View report.
SOGA: The State of Air Quality and Health Impacts in Africa (2022)
Africa experiences some of the worst air pollution and some of the most severe health consequences relative to the rest of the world. In 2019, air pollution was the second leading risk factor for death across Africa after malnutrition. In contrast, unsafe water, sanitation and hygiene was the fourth largest risk factor for deaths. This large, populous, and dynamic continent is home to 5 of the world’s 10 most heavily polluted countries in terms of ambient fine particulate matter. In Sub-Saharan Africa, an estimated 75% of the population relies on burning solid fuels such as coal, wood, charcoal, and dung for cooking, thus exposing over 800 million people to high concentrations of harmful pollutants at home every day. Air pollution exposures from household use of solid fuels and fossil fuel sources combine with demographic and other shifts affecting the underlying health of the population…In addition to the devastating human toll of the health impacts and loss of life from breathing polluted air, the economic toll of this pollution is substantial, with the annual cost of health damages due to disease related to air pollution amounting to an average of 6.5% of GDP across Africa. In Egypt, Ghana, Democratic Republic of the Congo, Kenya, and South Africa the combined annual cost of health damages from PM2.5 exposure is more than 5.4 billion U.S. dollars…Africa is rapidly urbanizing, on track to have 13 megacities (cities with more than 10 million residents) by 2100. Many countries across the continent are also rapidly industrializing. Economic development and growth hold the potential to raise the quality of life for many millions of people. But if household, industry, and transportation sources of air pollution are allowed to grow unchecked without proper environmental regulation, this development also has the potential to further exacerbate air pollution. Visit source. View report.
SOGA: Air Quality and Health in Cities (2022)
Cities are at the front line for air pollution impacts—and interventions. By 2050, almost 68% of the world’s population will be living in cities and breathing urban air. The pace of urbanization is particularly fast in low- and middle-income countries, which brings both challenges from the rapid increase in emissions and opportunities for improving air pollution control through city planning. Cities can take action to control key sources of urban pollution such as traffic, industrial activities, waste burning, the burning of solid fuels like coal and wood in homes, and power plants. However, it is important to note that relocation of pollution sources from within the city to the outskirts is often not a viable solution for improving air quality. Ambient (outdoor) fine particle air pollution (PM2.5) is made up of airborne particles measuring 2.5 μm or less in aerodynamic diameter. Anthropogenic (human) sources of PM2.5 include household burning, energy production and use, industrial activities, vehicles, and other sources. Exposure to PM2.5 can result in cardiovascular (heart), respiratory (lung), and other types of diseases. Nitrogen dioxide (NO2) is a gaseous pollutant and a key marker of traffic-related air pollution. NO2 is particularly abundant in cities and urban areas. NO2 and other nitrogen oxides can also react with other chemicals in the air to form particulate matter and ozone. Combustion of fossil fuels in vehicles, en- ergy production, and industries is the leading source of NO2. In cities, vehicles are often a major source of NO2 and people living close to roads and highways experience higher NO2 ex- posures. Exposure to NO2 can aggravate asthma symptoms and has been linked to the development of asthma in children and adults. There is also considerable evidence supporting the link between long-term exposure to NO2 and deaths. Visit source. View report.
SOGA: Trends in Air Quality and Health in Southeast Europe (2022)
Air pollution is responsible for 1 in 10 deaths in Southeast Europe…Across Southeast Europe, air quality remains a key concern Countries in the region experience exposures of fine particulate matter, or PM2 5, well above the World Health Organization (WHO) annual guideline value of 5 μg/m3 and air pollution ranked among the top 10 leading risk factors for death in 2019 (IHME 2020; GBD 2020) Economic costs of air pollution are also high in this region For example, the economic cost of deaths linked to ambient air pollution represents up to 10 5% of the total gross domestic product in the region, and total welfare losses from air pollution (PM2 5 and ozone) were estimated to cost Croatia, Bulgaria, and Romania 9%–13% of the gross domestic prod- uct of these nations, the largest cost among the 27 European Union (EU) countries (OECD 2020) At the same time, coverage of air quality monitors and availability of air quality data remain limited. Visit source. View report.
WHO: Ambient Air Quality Database (2022)
The recent update of the WHO air quality guidelines, a set of evidence-based recommendations for limit values of specific air pollutants, provides clear evidence of the damage that air pollution inflicts on human health, at even lower concentrations than previously recognized. The guidelines recommend new air quality levels to protect the health of populations. Moreover reducing the levels of key air pollutants will also contribute to slowing climate change (3). Pollutants for which new guidelines for annual mean values have been set are PM 2.5 , with a guideline value half the previous one, PM10 , which is decreased by 25 %, and that for nitrogen dioxide (NO2 ), which is four times lower than the previous guideline (Table 1)…As indicated in a recent report by the United Nations Environment Programme, “there is no common legal framework for Ambient Air Quality Standards (AAQS) globally and that effective enforcement of AAQS remains a significant legal challenge. Many countries lack legislation that sets AAQS or requires air quality monitoring and only a few address transboundary air pollution”. In its previous versions (2011, 2014, 2016 and 2018), the database contained data only on particulate matter (PM2.5 and PM10). Data on NO2 are now included in this fifth update. Visit source. View report.
CCAC: Air Pollution in Asia and the Pacific: Science-Based Solutions (2019)
Less than 8 per cent of the population of Asia and the Pacific enjoyed healthy air – within the World Health Organization (WHO) Guideline – in 2015. That means that around 4 billion people, the other 92 per cent of the population, spread unevenly across the region and with the highest numbers living in South and East Asia, are exposed to levels of air pollution that pose significant risks to their health. Improving the lives of such a vast number of people requires action to reduce the emissions that result in the formation of fine particulate matter (PM2.5) and ground-level ozone, both of which damage human health and well-being, as well as food production and the environment. If current policies aimed at limiting emissions are effectively introduced and enforced, air quality will be no worse in 2030 than it was in 2015, despite population growth, rapid urbanization and an ever-increasing demand for goods and services. But nor will it be any better. This suggests that current policies are mitigating air pollution in valuable but limited ways. Visit source. View report.
🧪 Chemicals
AR: The State of the World’s Chemical Pollution (2025)
The chemicals available on the world’s markets are of enormous diversity. Their total number is estimated to be approximately 350,000; this high number is a huge challenge for the systems of chemicals regulation and management worldwide. A main differentiation is between chemicals designed to have biological activity (pesticides and pharmaceuticals, termed intentionally potent, of which there are up to 10,000) and chemicals designed for other purposes (industrial chemicals, termed not intentionally potent, of which there are more than 300,000). Because of the complexity and number of chemicals to assess and the enormous variability of their uses, the regulatory system is overwhelmed and not sufficiently protective. Many industrial chemicals have not been sufficiently tested for hazardous properties, and even for pesticides, the testing is not sufficiently comprehensive. Moreover, because every chemical is considered as a new case to be investigated in detail, the regulatory system cannot avoid regrettable substitution (replacement of hazardous substances with similarly hazardous substances). Because of insufficient assessment and management, chemical pollution has become a serious global issue…As a result of their production and use, many of these chemicals will end up in the environment (water, air, soil, biota), may enter food webs (including those of humans), and will pose increasing challenges for the global society. In terms of tonnage, the production of synthetic organic chemicals has increased from 5 million t/year in 1950 to approximately 400–500 million t/year today. Visit source. View report.
EEB: ‘Forever Chemicals’ poisoning Europe’s waters and fish: (2025)
PFAS are a wide family of chemicals, characterised by their carbon – fluorine bond, one of the strongest chemical bonds there is in organic chemistry. This chemical group could be as large as 10,000 substances. Due to the strength of the chemical bond, PFAS chemicals are persistent in the environment, and some can also be mobile. Additionally, several PFAS substances bioaccumulate, are transported over long distances and have (eco)toxicological effects. It is already suggested that PFAS exceed the planetary boundary as detected levels in the environment, including rain, exceed health advisories and have already contaminated the environment irreversibly. The large number of PFAS used for professional and consumer application results in high emissions into the environment during production, use and end-of-life. The Nordic Council of Ministers estimates that around 100,000 sites across Europe are potentially emitting PFAS chemicals and a cross-European journalistic investigation identified more than 2,100 sites in Europe as PFAS hotspots – places where contamination reaches levels considered to be hazardous to the health of exposed people. In 2020, the estimated production volumes of PFAS in the EU ranged between 120,000 and 400,000 tonnes per year. However, almost 1 million tons of PFAS is estimated to be used and placed on the market yearly, with a growing trend. Visit source. View report.
OECD: PFASs and alternatives in hydraulic oils and lubricants (2025)
PFASs are used in various lubricant components across a wide range of different sectors and end uses. It is estimated that approximately one third of the PFASs used are in base oils (most notably PFPEs) and two thirds are micro-powder additives (almost entirely PTFE). PFASs are shown to impart wide and unique combinations of properties, that in turn enable a range of technical functions simultaneously. These are associated with key performance qualities that cannot be attained with more ‘conventional’ lubricants. While some progress is being made in substituting PFASs in these uses, and various non-fluorinated alternatives have been identified, manufacturers and downstream users of lubricants have highlighted the technical and economic challenges in developing suitable alternatives in many uses. This is mainly associated with the multi-functional aspect of PFASs in these uses, and it is suggested that, while alternatives can replicate some of the functionality needed, it is technically challenging to replace all desired functionality with one ‘drop in’ option. It is expected that, in the absence of significant market drivers towards substitution, the market for PFAS-based lubricants will expand in the future. It is currently indicated that PFAS-based lubricants are limited to uses that must withstand ‘harsh’ or ‘extreme’ conditions (e.g. related to temperature, pressure, corrosive chemicals, radiation etc) and where the use is considered by the user to be ‘critical’ (e.g. related to safety or reliability of equipment). However, what constitutes ‘harsh’ or ‘extreme’ conditions or ‘critical’ uses is subjective and likely to vary between sectors and users. This report highlights the importance of making an objective assessment of required performance requirements so it can be determined where, and for what functions, available alternatives can currently be used. Visit source. View report.
Royal Society of Chemistry: Metal contamination – a global environmental issue (2025)

Metal contamination (MC) is a growing environmental issue, with metals altering biotic and metabolic pathways and entering the human body through contaminated food, water and inhalation. With continued population growth and industrialisation, MC poses an exacerbating risk to human health and ecosystems. Metal contamination in the environment is expected to continue to increase, requiring effective remediation approaches and harmonised monitoring programmes to significantly reduce the impact on health and the environment…Metals enter the biosphere through a combination of natural and anthropogenic sources and processes. Natural sources include weathering of parent rocks, volcanic activity, erosion, sediment resuspension, and metal corrosion, whereas agriculture emerges as the most prominent anthropogenic contributor to global metal emissions. Since the industrial revolution in the 1760s, pollution of soils has been on the rise due to contamination by metal(loid) emissions from rapidly expanding industrial sources, such as manufacturing plants, coal burning, petrochemical releases/spills, atmospheric deposition, mining activities, waste disposal, application of wastewater for irrigation, agrochemicals such as pesticides and fertilizers, and soil amendments. Zinc, Pb, Cd, As, and Cr are frequently found in contaminated sites, with Cu, Hg and Ni also commonly present. Visit source. View report.
UN Report of the Special Rapporteur: Military activities and toxics (2025)
Contamination resulting from military activities has profound and lasting consequences for both human health and the environment. These impacts are not limited to combat zones or active warfare; they occur before, during and after military conflict. Toxic exposure affects not only military personnel but also civilians and communities, often in violation of international law. 95. Contamination caused by military activities arises from multiple sources: the use of certain weapons, such as depleted uranium, the construction, operation and abandonment of military bases, weapons testing (including nuclear weapons), equipment used in training (such as firefighting foams containing PFAS or lead ammunition), military scrapyards, oil spills and ship- breaking operations. These activities release hazardous substances that infiltrate air, soil and water systems and expose local populations. Military personnel involved in clean-up operations often suffer additional exposures. The human and environmental health consequences of military toxics are severe and often long term. Communities and military personnel have faced increased rates of cancer, organ failure, infertility, birth defects and psychological harm. Despite these well-documented harms, the environment and vulnerable communities continue to bear the brunt of toxic military practices, with little accountability or remediation. Indigenous Peoples and local communities are often displaced or forced to live amid dangerous contamination, particularly from polluted water sources near military sites. The damage inflicted on nature is equally alarming: polluting ecosystems, affecting biodiversity, aggravating the climate emergency and threatening endangered species. Addressing military-related toxic contamination is essential for the protection of human rights, human health and the environment. Recognition of the full life cycle of contamination – before, during and after conflict – is critical. The environmental pollution resulting from peacetime military activities underscores the urgent need for policies that ensure environmental safety and the prevention of toxic impacts throughout the production, operation and disposal of military equipment. Visit source. View report.
OECD: PFASs and Alternatives in Coatings, Paints and Varnishes: Hazard Profile (2023)

Given the technical suitability and high market penetration of the alternatives highlighted by the OECD (2022) report, it is important to also understand their hazard profiles. The likelihood of regrettable substitution could be high if the health and environmental hazards are not understood and communicated. This study aims to complement the 2022 report by compiling information on the hazard profile of the FPs, SC PFAS and non-fluorinated substances identified in terms of hazard classifications from authorities and industry and available assessments from authorities on persistence, bioaccumulation, environmental and health hazards. The main search for this study was conducted during January – July 2022, and the report was revised based on feedback from the stakeholders during January – March 2023. This study demonstrates that the hazard profiles of many of the FPs, SC PFASs and non-fluorinated alternatives used in CPVs are not available. Out of the 45 substances identified in the OECD (2022) report and examined here, only nine substances have been classified by authorities and 30 by industry, while published assessments by authorities were available for just over half of the fluorinated substances and a significantly lower proportion of the nonfluorinated alternatives. No classifications or hazard assessments were identified for 15 substances…The findings of this study have demonstrated that the hazard profiles of the majority of FPs, SC PFASs and non-fluorinated alternatives used in CPVs are poorly understood and/or not publicly available. Visit source. View report.
UNEP: Chemicals in Plastic (2023)
All plastics are made of chemicals, including basic polymers and solvents; additives such as plasticizers, flame retardants, stabilizers or pigments used to deliver the material’s functionality; and unintentional chemical residues resulting from incomplete processing during the chemical synthesis and plastic manufacturing stages. With the continuous increase in plastic production worldwide, the production of plastic-associated chemicals has also increased, both in quantity and diversity. In 2017, the annual global primary plastic production was 438 million tonnes, of which 27 million tonnes (6%) were additives, and primary plastic production is projected to reach 1.1. billion tonnes in 2050 if the current trend continues. While the adverse physical impacts of plastics in the environment are often visible, less apparent are the health risks associated with the chemicals used to produce or found in plastics and subsequently released into the environment. Latest research has identified over 13,000 chemicals associated with plastics and plastic manufacturing across a wide range of applications such as packaging, building and construction, consumer and institutional products, automotive and transportation, electrical, and many more. Amongst these, 7,000 chemicals have been screened for their hazardous properties, of which more than 3,200 plastic monomers, additives, processing aids, and non-intentionally added substances have been identified as chemicals of potential concern based on their hazardous properties (Annex 1; Aurisano et al. 2021b; Wiesinger et al. 2021)…Many of these chemicals of concern are used, emitted, and released throughout the plastic life cycle – from the extraction of oil and gas and the production of polymers and chemicals to the manufacturing, use, and end-of-life management of plastics. These chemicals have been found to be associated with a wide range of acute, chronic, or multi-generational toxic effects, including specific target organ toxicity, various types of cancer, genetic mutations, reproductive toxicity, developmental toxicity, endocrine disruption and ecotoxicity. However, information on chemicals in plastics is rarely transmitted along the plastics life cycle and is therefore unavailable to regulatory authorities, consumers, and waste managers. Visit source. View report.
UNEP: Global Framework on Chemicals (2023)
The sound management of chemicals and waste is essential for protecting human health and the environment. While progress in minimizing adverse impacts of chemicals and waste has been made, the global goal on chemicals management adopted at the World Summit on Sustainable Development (2002) – to achieve, by 2020, that chemicals would be used and produced in ways leading to the minimization of significant adverse effects on human health and the environment – was not achieved by 2020. More ambitious and urgent action by all stakeholders and sectors is required in order to protect present and future generations. Chemicals play an important role as an integral part of our everyday lives in materials, articles and products globally. Their sound management is crucial for preventing and, where prevention is not feasible, minimizing adverse impacts on human health and the environment. The economic,1 environmental and social benefits of action are indisputable, in particular to achieve the good health and well-being of all populations. The Global Chemicals Outlook II cautions that “business as usual” is not an option. The global chemical industry was estimated at US$ 5 trillion in 2017 and its size is projected to double by 2030.3 Hazardous chemicals continue to be released in large quantities. Scientific evidence alerts us that pollution from chemicals and waste is not sustainable. Exposure to hazardous chemicals and waste throughout their supply chains and life cycles threatens human health and disproportionately impacts vulnerable and at-risk groups. Visit source. View report.
Lancet: Pollution and health: a progress update (2022)
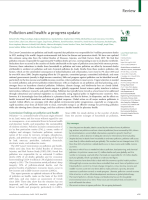
Deaths from these modern pollution risk factors, which are the unintended consequence of industrialisation and urbanisation, have risen by 7% since 2015 and by over 66% since 2000. Despite ongoing efforts by UN agencies, committed groups, committed individuals, and some national governments (mostly in high-income countries), little real progress against pollution can be identified overall, particularly in the low-income and middle-income countries, where pollution is most severe. Urgent attention is needed to control pollution and prevent pollution-related disease, with an emphasis on air pollution and lead poisoning, and a stronger focus on hazardous chemical pollution. Pollution, climate change, and biodiversity loss are closely linked. Successful control of these conjoined threats requires a globally supported, formal science–policy interface to inform intervention, influence research, and guide funding. Pollution has typically been viewed as a local issue to be addressed through subnational and national regulation or, occasionally, using regional policy in higher-income countries. Now, however, it is increasingly clear that pollution is a planetary threat, and that its drivers, its dispersion, and its effects on health transcend local boundaries and demand a global response. Global action on all major modern pollutants is needed. Visit source. View report.
OECD: PFASs and Alternatives in Coatings, Paints and Varnishes: Commercial Availability and Current Uses (2022)
To assess the uses of PFAS and their alternatives in CPVs it has been necessary to go into sufficient detail to understand the function of PFAS in specific applications, rather than generalising at the sector or market segment level. From the wide range of applications that comprise the CPV sector, three applications have been examined more closely: coatings for cables and wiring, the front and backsheets of solar panels and household and architectural paints…PFASs are synthetic substances that are widely used in numerous technologies, industrial processes and everyday applications. Since the discovery of polytetrafluoroethylene (PTFE) in 1938, PFASs, both polymeric and non-polymeric, have been used extensively in various industries worldwide, due to factors such as dielectrical properties, resistance to heat and chemical agents, anti-weathering, anti-UV (ultraviolet) fading and surfactant properties. The highly stable carbon-fluorine bond and the unique physicochemical properties of PFASs make these substances valuable ingredients for products with high versatility, strength, resilience and durability. Since 2002, there has been a trend amongst global manufacturers to replace so-called ‘long-chain’ (LC) PFASs, their salts and their potential precursors with chemicals containing shorter perfluoroalkyl chains or with non-perfluoroalkyl products. This trend is largely driven by concerns related to the properties of certain LC PFASs with respect to health and the environment. Visit source. View report.
OECD: PFASs and Alternatives in Food Packaging (Paper and Paperboard): Hazard Profile (2022)
Given the technical suitability of some of the alternatives highlighted by the OECD (2020) [“PFASs and alternatives in food packaging (paper and paperboard): Commercial availability and current uses”] report, it is important to also understand their hazard profiles. The likelihood of regrettable substitution could be high if the health and environmental hazards of these alternatives are not understood and communicated. This study aims to complement the 2020 report by compiling information on the hazard profile of the alternatives identified in terms of hazard classifications from authorities and industry and available assessments from authorities on persistence, bioaccumulation, environmental and health hazards. This study demonstrates that the hazard profiles of the many of the alternatives to long-chain PFAS for paper and paperboard food packaging are not available. Out of the 58 alternatives examined, only ten alternatives have been classified by authorities and 26 by industry, while published assessments by authorities were available for just over half of the fluorinated alternatives and a significantly lower proportion of non-fluorinated alternatives. No classifications or hazard assessments were identified for 18 alternatives…The findings of this study have demonstrated that the hazard profiles of the majority of alternatives to long-chain PFAS for paper and paperboard food packaging are poorly understood and/or not publicly available. Efforts to develop inventories of PFAS that are manufactured and used global have proved difficult (Wang et al., 2014) and a large majority of PFAS have not been registered or notified under chemical legislation such as REACH in the EU. Visit source. View report.
OECD: PFASs and Alternatives in Food Packaging (Paper and Paperboard): Commercial availability and current uses (2020)
Short-chain (SC) PFAS and non-fluorinated alternatives to long-chain (LC) PFAS are available on the global market and can be used to produce paper and board for use in food packaging. There are 28 fluorinated substances currently included2 on the US Federal Drug Administration (FDA) list to confer grease/oil/water resistance to paper and board. These are reported to be used in 19 formulations (DTSC, 2020[1]). The German Bundesinstitut für Risikobewertung (BfR) recommended list contains 12 fluorinated substances that are listed as surface refining and coating agents and which are likely to be used to confer grease and water resistance for food packaging. On performance alone, both SC PFAS and non-fluorinated alternatives identified in this study can meet the high grease and water repellence specifications required for the common food and pet food packaging uses. For some applications, non-fluorinated alternatives have a performance advantage over SC PFAS. The current market share of non-fluorinated alternatives appears to be approximately 1% or less. The key reason for the current lack of market share of non-fluorinated alternatives is the higher cost of non-fluorinated alternatives, which results in paper and board for food packaging between 11-32% more expensive than food packaging using SC PFAS. Visit source. View report.
UNEP: Global Chemicals Outlook II (2019)
Global income levels are rising and the global middle class is expanding, creating increasing demand for a range of goods and products for which chemistry is essential. Chemical-intensive industry sectors (e.g. construction, agriculture, electronics, cosmetics, mining and textiles) are growing, affecting market demand for chemicals and creating both risks and opportunities. In light of these trends and the changing consumption and production patterns that accompany them, the chemical industry is growing rapidly. The production and consumption of chemicals has spread worldwide, with an increasing share now located in low- and middle-income countries, many of which may have limited regulatory capacity. Cross-border trade in chemicals and products is also growing, and increasing amounts of chemicals are shipped through long and complex global supply chains…Many chemicals, products and wastes have hazardous properties and continue to cause significant adverse impacts on human health and the environment because they are not properly managed. Chemicals or groups of chemicals that are receiving attention in research and policymaking because of their hazardous properties and potential risks include, but are not limited to, carcinogens, mutagens and chemicals hazardous to reproduction, persistent bioaccumulative and toxic substances, endocrinedisrupting chemicals, and chemicals with neurodevelopmental effects…Ensuring the sound management of chemicals and waste, as called for internationally at the highest political level during several major United Nations Conferences, is essential to advance sustainable development across its social, economic and environmental dimensions. Visit source. View report.
UNEP/ICCA: Knowledge Management and Information Sharing for the Sound Management of Industrial Chemicals (2019)
There are an estimated 40,000 to 60,000 industrial chemicals in commerce globally. An estimated 6,000 of them account for more than 99% of the total volume of industrial chemicals in commerce globally. A number of factors contribute to the uncertainty in the estimates of the numbers of chemicals, including: a lack of chemical inventories for many countries in the world; uncertain and variable definitions of industrial chemicals in commerce (i.e., different scopes); varying volume thresholds for reporting; uncertainty as to whether or not listed chemicals are actually on the market; and lack of reporting or misreporting to government authorities. There are EHS data existing to support varying degrees of screening level hazard and risk assessment for the majority of the highest production volume chemicals and while knowledge gaps still exist for many lower volume chemicals, they are rapidly being addressed by: Recently adopted legislation and regulations (e.g., EU REACH, K-REACH, China-REACH, etc.); market forces (e.g., demand for “Green Chemistry”); and newly developing predictive hazard identification tools (e.g., computational toxicology) that are quicker and more resource efficient. There is a need for more and better chemical hazard, use and exposure information, particularly from developing countries, to improve hazard and risk assessment and risk management. This report identifies more than 100 publicly available EHS information sources, spanning nearly 50 countries spread across 4 continents. The report provides profiles of 41 of the largest and most comprehensive of them: 7 are portals which provide easy access to multiple, third-party owned databases; 10 provide access to EHS-type regulatory decisions, but not to any specific EHS data per se; the remaining 24 represent primary EHS information sources…The description and information on the scope, strengths, and limitations of each database will inform policy makers on how such databases on chemicals have been developed and how they are fit for purpose, which can support further developments in chemicals management policies at the national and global level. Visit source. View report.
OECD: Summary Report on the New Comprehensive Global Database of PFASs (2018)
In total, 4730 PFAS-related CAS numbers have been identified and manually categorised in this study, including several new groups of PFASs that fulfil the common definition of PFASs (i.e. they contain at least one perfluoroalkyl moiety) but have not yet been commonly regarded as PFASs. The identified PFASs are diverse in terms of structure and other categorisation elements. In addition, the number and type of identified PFASs vary considerably across sources. Several limitations, gaps and challenges were identified, including (1) information gaps within the information sources searched, (2) gaps associated with information sources that were included, (3) limitations associated with the format of the study (as a snap shot of the situation when the study was done, while information may continuously evolve), and (4) challenges associated with the vague description of some PFASs identified, the currently used terminology of PFASs, and the current state of knowledge about certain aspects such as the degradability of many PFASs. As such, it should be noted that while this list is comprehensive, it is not an exhaustive list. Based on lessons learned from identified limitations, gaps and challenges, opportunities for future improvement have also been identified. In particular, there is a need for an intensified dialogue and cooperative actions across regions and sectors, designing and fostering new types of public-private partnerships to facilitate effective and efficient information exchange between public and private sectors within the field of PFASs. Additional recommendations include (1) expansion of the current terminology of PFASs to reflect all substances and resolve issues identified (e.g., no clear cut-off values between some substance groups), (2) development of a web-based knowledge base to share up-todate information on PFASs across sectors and regions, and (3) continuous support to address critical knowledge gaps including the degradability of many non-studied PFASs. Visit source. View report.
UNEP: Global Chemicals Outlook (2013)
Chemicals are an integral part of modern daily life. There is hardly any industry where chemical substances are not used and there is no single economic sector where chemicals do not play an important role. Millions of people throughout the world lead richer, more productive and more comfortable lives because of the thousands of chemicals on the market today. These chemicals are used in a wide variety of products and processes and, while they are major contributors to national and world economies, their sound management throughout their lifecycle is essential in order to avoid significant and increasingly complex risks to human health and ecosystems and substantial costs to national economies…Industries producing and using these substances have a significant impact on employment, trade and economic growth worldwide, but the substances can have adverse effects on human health and the environment. A variety of global economic and regulatory forces influence changes in chemical production, transport, import, export, use and disposal over time. In response to the growing demand for chemical-based products and processes, the international chemical industry has grown dramatically since the 1970s. Global chemical output was valued at US$ 171 billion in 1970; by 2010, it had grown to US$ 4.12 trillion. Many national governments have enacted laws and established institutional structures for managing the hazards of this growing volume of chemicals. Leading corporations have adopted chemical management programmes and there are now many international conventions and institutions for addressing these chemicals globally. However, the increasing complexity of the background mix of chemicals and the ever longer and more intricate chemical supply chain including wastes reveal varied gaps, lapses and inconsistencies in government and international policies and corporate practices. They feed growing international concerns over the threat that poor management of chemicals pose to the health of communities and ecosystems. Visit source. View report.
🛍️ Novel Entities
WEF: Plastic Pollution and Biodiversity: a Global Overview (2026)
By tackling plastic pollution and biodiversity loss as an interconnected challenge, we can conserve the critical ecosystems that underpin the viability of human societies and economies. Rates of extinction among animal and plant species are now tens to hundreds of times higher than the historical average. Plastic pollution is among the top five drivers of this biodiversity loss. Since 1950, annual plastic production has surged from 2 million to nearly 500 million tonnes, yet only 10% of all plastic ever made has been recycled. Every year, 130 million tonnes of plastic waste pollutes the planet’s air, land and water. Without urgent action, that figure could more than double by 2040 – equivalent to dumping a lorry-load of plastic on nature every second. Plastic waste harms biodiversity in three ways. Through physical harm – entanglement and ingestion – it affects over 4,000 species, from zooplankton to whales. It degrades habitats, suffocating mangrove roots, elevating disease risk in coral reefs and contaminating nesting sites for sea turtles. And through chemical pollution, it disrupts reproductive systems and compromises soil fertility and crop yields. The economic stakes are huge. One peer-reviewed study concluded that the 75-150 million tonnes of plastic in the world’s oceans have led to losses of between $500 billion and $2.5 trillion in marine ecosystem services every year. Plastic pollution is eroding fisheries, coastal tourism, agricultural productivity and the carbon sequestration capacity of ecosystems such as mangroves, which store four times more carbon per hectare than tropical forests. Plastic’s greenhouse gas emissions of 2.7 billion tonnes a year are on course to exceed every country’s in the world, bar China and the US, by 2040…Companies across the plastics value chain – from producers and packagers to consumer brands that rely on them – are encouraged to embed biodiversity into their core strategies, disclose plastic-related impacts, and include EPR and biodiversity in their risk registers. Visit source. View report.
OC: United States of Plastics (2025)
Plastic pollution is one of the most pressing threats to ocean health. Every year, over 11 million metric tons of plastic pollution enter the ocean. That amounts to more than a garbage truck’s worth of plastics entering the ocean every minute. While the ocean, and the vital wildlife and ecosystems it holds, have endured significant harm from this crisis, pollution from plastics has now impacted every dimension of the planet—including human health…Plastic pollution is not only an environmental issue but also an economic one. Local governments and taxpayers are forced to shoulder the escalating costs of managing an ever-increasing volume of complex plastic waste. Municipal waste systems are overwhelmed, recycling infrastructure is under strain, and pollution continues to damage natural and built environments. Beyond waste management, communities face mounting costs related to cleanup operations, infrastructure degradation and reduced economic activity from fisheries, agriculture and tourism. As the number one generator of plastic waste worldwide and a major producer of virgin plastic, the United States has the opportunity and responsibility to play a leading role in solving this crisis. Within the U.S., states have been and will continue to be the leaders in environmental conservation, including in tackling plastic pollution. Driven by public pressure and the rising costs of recycling and managing plastic pollution, momentum for action at the state level is at an all-time high. While no two states are identical in their approach, there are tried and tested policies developed around the country that can significantly reduce plastic pollution. Ocean plastic pollution doesn’t just come from beaches and coastal communities. Plastics enter our ocean directly from sources including rivers, canals and storm drains, and via less direct routes, such as wind and runoff, that can start far upstream and inland, eventually flowing into the ocean. Visit source. View report.
EIP: Feeding the Plastics Industrial Complex (2024)
The rapidly growing plastics industry in the U.S. receives billions of dollars in government subsidies. Yet too many of these companies frequently violate their air pollution control permits, often releasing hazardous chemicals that risk the health and safety of nearby communities. More than 66 percent of the people living within three miles of the factories that manufacture the main ingredients in plastic products are people of color, living in communities that are over-exposed to air pollution while schools and other public services are chronically underfunded. This report examines the 50 plastics plants built or expanded in the U.S. since 2012 and whether the public funds used to subsidize this industry are addressing these inequities or making the problem worse by depriving local communities of tax revenues while harming their quality of life. That question needs to be answered sooner rather than later, given plans to build 10 more new plastics manufacturing plants and expand the capacity of 17 more over the next five years, often with taxpayer subsidies…The poor environmental track record of these plastics plants is alarming because the industry is expanding rapidly, and more communities are being asked to consider public subsidies. Visit source. View report.
OCED: Policy Scenarios for Eliminating Plastic Pollution by 2040 (2024)
Business as usual is unsustainable as plastic flows and their environmental impacts will continue to grow rapidly. a. Annual plastics production and use is projected to rise from 435 million tonnes (Mt) in 2020 to 736 Mt in 2040 in the Baseline scenario. The share of recycled plastics would remain unchanged at 6% of total plastics use (41 Mt in 2040).; b. While waste management is expected to improve, advances will not keep pace with the growth of plastic waste (617 Mt in 2040, up from 360 Mt in 2020), resulting in 119 Mt of mismanaged waste in 2040 (increasing from 81 Mt in 2020).; c. Leakage of plastics to the environment will continue (30 Mt in 2040, up from 20 Mt in 2020), amplifying adverse environmental and health impacts. The stock of plastics in rivers and oceans will almost double from 152 Mt in 2020 to 300 Mt by 2040.; d. The plastics lifecycle will emit 2.8 gigatonnes of carbon dioxide equivalent (GtCO2e) of greenhouse gas (GHG) emissions annually by 2040 (5% of global emissions), up from 1.8 GtCO2e in 2020, primarily driven by the production and conversion of plastics. Partial measures, such as policy responses focused on enhancing waste management alone or global action with broad policy coverage but with low policy stringency, are likely to fall short of ending plastic pollution, as are policy responses with ambitious action along the lifecycle implemented only in advanced economies…The implementation of stringent policies along the plastics lifecycle in all countries can prevent growth in primary plastics production from 2020 levels and nearly end plastic leakage to the environment by 2040. Visit source. View report.
Planet Tracker: Novel Entities – A Financial Time Bomb (2024)
There are hundreds of thousands of novel entities – toxic substances created by humans and released into the environment that may be disruptive to the planet – travelling through the global economy. Novel entities are so ubiquitous because of their usefulness. However, how they are controlled, released and subsequently cause damage to environmental and human health is of global concern. There is relatively little knowledge of the impacts of novel entities, including synthetic organic pollutants, genetically modified organisms and micro and nano materials. Novel entities are a cross-sector problem which affect both the state of the environment as well as human health. However, most novel entities have not undergone safety assessments or information on those are protected or not shared. The precautionary principle c should be used to manage novel entities. Evaluating novel entities after they have been created and released is not acceptable. Novel entities need better regulation so that only those that are properly tested are used in commercial products and applications. There is undoubtedly a challenge in accessing data on the production and release of novel entities unless regulatory authorities are authorised to release this data publicly and ensure it is up to date. The challenge of estimating a planetary boundary for novel entities is therefore not only driven by the lack of emission data, but also by the scarcity of data on how these novel entities impact the environment. Visit source. View report.
UNEP: Turning off the Tap (2023)
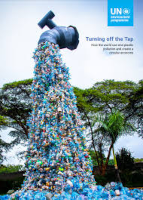
In a historic decision at the fifth United Nations Environment Assembly in March 2022, all 193 UN Member States decided to end plastic pollution. With negotiations on a binding legal agreement by 2024 now underway, the question is how to realise that goal. While many technical solutions for a circular plastics economy are known, the economic, fiscal and business models to address the associated impacts while also safeguarding livelihoods are less clear. This report examines these issues and proposes a systems change scenario - addressing the causes of plastic pollution, rather than just the symptoms. Such a systems change will enable countries to turn off the tap and end plastic pollution while at the same time transitioning towards safer and more stable jobs for those currently working in the informal sector, and create business and job opportunities. The report analyses the opportunities and impacts of a systems change scenario. The scenario combines reducing the most problematic and unnecessary plastic uses with a market transformation towards circularity in plastics by accelerating three key shifts - Reuse, Recycle, and Reorient and Diversify – and actions to deal with the plastic pollution legacy. Visit source. View report.
OECD: Global Plastics Outlook (2022)
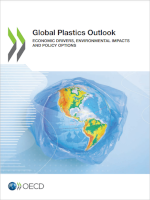
The current plastics lifecycle is far from circular. Globally, the annual production of plastics has doubled, soaring from 234 million tonnes (Mt) in 2000 to 460 Mt in 2019. Plastic waste has more than doubled, from 156 Mt in 2000 to 353 Mt in 2019. After taking into account losses during recycling, only 9% of plastic waste was ultimately recycled, while 19% was incinerated and almost 50% went to sanitary landfills. The remaining 22% was disposed of in uncontrolled dumpsites, burned in open pits or leaked into the environment…Mismanaged plastic waste is the main source of macroplastic leakage. In 2019 alone, 22 Mt of plastic materials leaked into the environment. Macroplastics account for 88% of plastic leakage, mainly resulting from inadequate collection and disposal. Microplastics, polymers with a diameter smaller than 5 mm, account for the remaining 12%, coming from a range of sources such as tyre abrasion, brake wear or textile washing. The documented presence of these small particles in freshwater and terrestrial environments, as well as in several food and beverage streams, suggests that microplastics contribute substantially to the exposure of ecosystems and humans to leaked plastics and their related risks..Significant stocks of plastics have already accumulated in aquatic environments, with 109 Mt of plastics accumulated in rivers, and 30 Mt in the ocean…The carbon footprint of the plastics lifecycle is significant…While global production of secondary plastics from recycling has more than quadrupled in the last two decades, they are still only 6% of the total feedstock. Since secondary plastics are mainly considered substitutes for primary plastics, rather than a valuable resource in their own right, the secondary plastics market remains small and vulnerable…Considering global value chains and international trade in plastics, aligning design approaches and the regulation of chemical substances across countries will be key to improving the circularity of plastics globally. Visit source. View report.
EEA: Plastics, the circular economy and Europe’s environment (2021)
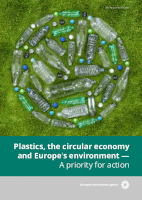
Plastics comprise a range of materials, each with its own unique characteristics, properties and applications — 99 % of plastics are made from carbon from fossil fuels. The consumption and production of plastics have grown exponentially since the 1950s, with the resulting products (including packaging, kitchenware, electronics, textiles, car components and furniture) constituting an important part of everyday life. Plastics are light, cheap, durable and can be made in an infinite number of variations, and the plastics industry contributes to growth and job creation. Plastic packaging is the largest sector of the plastics industry, representing almost 40 % of total plastic consumption…In recent years, plastic has been subject to increased focus and attention from an environmental perspective. Being lightweight and durable are two key strengths of plastic, but this also means that plastic spreads easily and can persist in the environment for many years. Plastic waste can now be found in our parks, on our beaches, at the bottom of the oceans and seas, on top of mountains and even inside our bodies. The leakage of plastics into the environment poses a significant problem for current and future generations, and there are significant gaps in our knowledge about the kind of effects that this exposure can have…Today, plastics are too often used as single use products, then discarded, then too often littered. The current linear models of production and consumption of plastics are failing nature and our economy at the same time, which is why we need a circular plastics economy. Reducing the environmental and climate impacts of plastics, while retaining the usefulness of plastics in society, requires making the systems of plastic consumption and production more circular, resource efficient and sustainable, thereby enabling longer use, reuse and recycling. Adequate policies and the scaling of circular business models can, together with changes in the behaviour of producers and consumers, enable a more circular and sustainable plastics system. Visit source. View report.
FAO: Assessment of Agricultural Plastics and their Sustainability (2021)
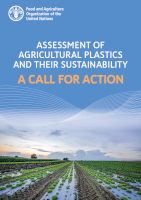
The use of plastic products in today’s agriculture is becoming increasingly commonplace all around the world. The versatility and variety of plastic polymers, their ease of manufacture, physical properties and affordability make them the material of choice for many applications in agriculture. Most fishing gear is made of plastic. Plastic greenhouse and mulching films together with drip irrigation help fruit and vegetable growers to increase yields, reduce water and herbicide use, and control crop quality. Polymer coated controlled release fertilizer provide plants with the nutrients at the rate they need, avoiding emissions to water and air. Silage films help livestock farmers produce healthy, longlasting and nutritious fodder, and avoid the need to construct barns and silage clamps. Plastic tree guards are used extensively in tree plantations. All these products provide a range of benefits that help farmers, foresters, and fishers to maintain livelihoods, enhance production, reduce losses, conserve water and reduce chemical inputs. However, despite the many benefits listed above, agricultural plastics also pose a serious risk of pollution and harm to human and ecosystem health when they are damaged, degraded or discarded in the environment. In 2019, agricultural value chains used 12.5 million tonnes of plastic products in plant and animal production and 37.3 million tonnes in food packaging. Data were not available for usage in storage, processing, and distribution. Furthermore, the agricultural plastic industry forecasts the global demand for greenhouse, mulching and silage films to increase by 50 percent from 6.1 million tonnes in 2018 to 9.5 million tonnes in 2030. The crop production and livestock sectors are the largest users, accounting for 10 million tonnes per year collectively, followed by fisheries and aquaculture with 2.1 million tonnes, and forestry with 0.2 million tonnes. Despite limitations in regional usage data, Asia was estimated to be the largest user of plastics in agricultural production; accounting for up to six million tonnes annually, almost half of global usage. Data suggest that only small fractions of agricultural plastics are collected and recycled, predominately in developed economies. There is evidence that elsewhere most plastics are burned, buried, or landfilled, although record keeping is generally non-existent. Visit source. View report.
OECD: Policies to Reduce Microplastics Pollution in Water (2021)
Microplastics pollution is one of the most pervasive emerging environmental issues. Tiny plastic fragments, particles and fibres now widely contaminate oceans, freshwaters, soils and air. Once in the environment, microplastics may continue to fragment into smaller particles and persist for a long time. Aquatic species, from plankton to large mammals, as well as humans are commonly exposed to microplastics via ingestion or inhalation. A myriad of emission sources contribute to microplastics pollution. Examples are accidental industrial spillages, the discharge of microplastics intentionally added to products (e.g. rinse-off cosmetics and detergents) and the wear and tear of synthetic products (e.g. synthetic textiles, vehicle tyres) occurring during their use. Up to 3 Mt of microplastics enter the environment every year. Additionally, the degradation of plastic waste discarded into the environment further contributes to microplastics pollution. Microplastics pollution is a reason of concern for water quality, potentially affecting ecosystems and human health. Laboratory experiments have shown that microplastics ingestion can induce adverse health effects in aquatic biota, although large uncertainties persist with regards to the thresholds at which risks may occur. Concerns are mainly driven by the presence in plastics of toxic chemicals and known or suspected endocrine disrupting additives, as well as by the potential for microplastics to sorb persisting organic pollutants from the environment. Although data gaps hinder reliable risk assessments, the persistence of plastics and the projected fast and continued increases in pollution levels call for policy measures to mitigate current and future risks to ecosystems and human health. Visit source. View report.
UNEP: From Pollution To Solution: A Global Assessment of Marine Litter and Plastic Pollution (2021)
The amount of marine litter and plastic pollution has been growing rapidly. Emissions of plastic waste into aquatic ecosystems are projected to nearly triple by 2040 without meaningful action. The scale and rapidly increasing volume of marine litter and plastic pollution are putting the health of all the world’s oceans and seas at risk. Plastics, including microplastics, are now ubiquitous. They are a marker of the Anthropocene, the current geological era, and are becoming part of the Earth’s fossil record. Plastics have given their name to a new marine microbial habitat, the “plastisphere”. Despite current initiatives and efforts, the amount of plastics in the oceans has been estimated to be around 75-199 million tons. Estimates of annual global emissions from land-based sources vary according to the approaches used. Under a business-asusual scenario and in the absence of necessary interventions, the amount of plastic waste entering aquatic ecosystems could nearly triple from some 9-14 million tons per year in 2016 to a projected 23-37 million tons per year by 2040. Using another approach, the amount is projected to approximately double from an estimated 19-23 million tons per year in 2016 to around 53 million tons per year by 2030. Marine litter and plastics present a serious threat to all marine life, while also influencing the climate. Visit source. View report.
UNEP: Drowning in Plastics (2021)
Global plastic production has risen exponentially over the last decades – now amounting to some 400 million tonnes per year. Although plastic serves many useful purposes, its rapidly growing production and consumption, coupled with a lack of a circular approaches – keeping plastic in the economy and out of the environment – and the extensive leaking of microplastics into nature, all constitute an urgent environmental emergency. Currently, it is estimated that 19-23 million tonnes of plastic leaks into aquatic ecosystems annually – from lakes to rivers to seas – from land-based sources. Exacerbated by contributions from sea-based sources, this combined plastic leakage is having major impacts on ecosystems, economies and society – including on human health…Plastics can escape into the environment at every stage of their life cycle. During production, transport or conversion, plastic pellets or fibres may be lost. It has been estimated that 60-99 million tonnes of mismanaged plastic waste were produced globally in 2015, and that this amount could increase to 155-265 million tonnes per year by 2050 under a business as usual scenario. The main leakage of plastics to the environment usually occurs following use and during disposal, with large volumes lost as a result of littering and lack of environmentally sound waste management practices. An estimated 19-23 million tonnes of plastic waste entered aquatic ecosystems from land-based sources in 2016. Sea-based pollution from sources such as shipping, fishing, offshore installations or dumping of refuse at sea also contributes significantly to the loss of plastics to the environment. Some are collected and sorted through formal or informal waste management schemes or by manufacturers, turned into plastic pellets or flakes, and re-enter the production and use phase. However, most plastics are incinerated, openly burned, disposed of in fishing industry alone is thought to be responsible for some 1 million tonnes of plastic waste (e.g. plastic nets, fishing line) entering the ocean each year. Developing a circular plastic economy and limiting plastic pollution require multilevel actions by different stakeholders. Visit source. View report.
Pew: Breaking the Plastic Wave (2020)
The flow of plastic into the ocean is projected to nearly triple by 2040. Without considerable action to address plastic pollution, 50 kg of plastic will enter the ocean for every metre of shoreline. Our analysis shows that a future with approximately 80 per cent (82 ±13 per cent) less annual plastic leakage into the ocean relative to business as usual is achievable by 2040 using existing technologies. This pathway provides benefits to communities, to governments, and even to industry. However, it depends on the immediate, ambitious, and concerted global implementation of solutions across the entire plastics value chain. This vision for system change represents an attractive and viable way forward. Plastic pollution in the ocean is a major environmental challenge, yet a coherent global strategy to solve this growing crisis remains elusive. It is a by-product of fundamental flaws in an essentially linear plastic system in which 95 per cent of aggregate plastic packaging value— US$80 billion-US$120 billion a year—is lost to the economy following a short first-use cycle. Very different responses to the crisis have been proposed, from eliminating plastic entirely to turning it into fuels, and from developing biodegradable substitutes to recycling plastic back into usable products. Each solution comes with advantages and drawbacks. Understanding the effectiveness of different solutions, and the related economic, environmental, and social implications, is crucial to making progress towards stopping ocean plastic pollution. Visit source. View report.
WWF: Assessing Plastic Ingestion from Nature to People (2019)
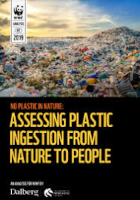
A new study by the University of Newcastle, Australia suggests that an average person could be ingesting approximately 5 grams of plastic every week. The equivalent of a credit card’s worth of microplastics. This summary report highlights the key ways plastic gets into our body, and what we can do about it. Increasing plastic use and limited recycling results in towering plastic production. Since 2000, the world has produced as much plastic as all the preceding years combined, a third of which is leaked into nature. The production of virgin plastic has increased 200-fold since 1950 and has grown at a rate of 4 per cent a year since 2000. If all predicted plastic production capacity is reached, current production could increase by 40 per cent by 2030. As of today, a third of plastic waste ends up in nature, accounting for 100 million metric tons of plastic waste in 2016. Plastic is used as a disposable material, to such an extent that over 75% of all plastic ever produced is waste. A significant portion of this waste is mismanaged. Mismanaged waste is a direct result of underdeveloped waste management infrastructure and refers to plastic left uncollected, openly dumped, littered, or managed through uncontrolled landfills6 . Of this mismanaged waste, about 87% is leaked into nature and becomes plastic pollution. For instance, if nothing changes, the ocean will contain 1 metric ton of plastic for every 3 metric tons of fish by 2025. Plastic pollution affects the natural environment of most species on the planet…Microplastics are contaminating the air we breathe, the food we eat, and the water we drink. Visit source. View report.
AS: Global & Gallatin Microplastics Initiatives (2018)
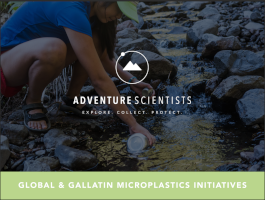
The Microplastics Initiatives of Adventure Scientists conducted surveys of microplastics pollution in aquatic ecosystems from 2013-2017. The field of microplastic study is young, and at project inception there was not then a clear understanding of the abundance and distribution of microplastic pollution across global and local geographies. Sources, transport pathways, and effects are all understudied and solutions to this emerging environmental challenge continue to be sought. In this project, Adventure Scientists, in partnership with Ocean Analytics, conducted two distinct survey efforts - the Global and Gallatin Microplastic Initiatives - in order to fill a data gap critical to addressing the problem. The results show that globally, microplastics are accumulating at a higher rate in marine systems (89% of samples contained microplastic pollution) than in freshwater systems (51% of samples contained microplastic pollution). Our findings also show microplastic contamination is ubiquitous across remote sample locations in both marine (including polar regions) and freshwater systems (including in glaciers around the world and the headwaters of the Missouri River). These data help form a baseline for understanding the extent and severity of contamination, and thus will inform future studies, solutions in industry, policy action, and citizen advocacy. Visit source. View report.
WEF: The New Plastics Economy: Rethinking the Future of Plastics (2016)
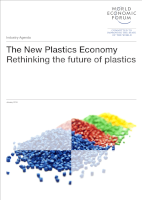
Plastics have become the ubiquitous workhorse material of the modern economy – combining unrivalled functional properties with low cost. Their use has increased twentyfold in the past half-century and is expected to double again in the next 20 years. Today nearly everyone, everywhere, every day comes into contact with plastics – especially plastic packaging, the focus of this report. While delivering many benefits, the current plastics economy has drawbacks that are becoming more apparent by the day. After a short first-use cycle, 95% of plastic packaging material value, or $80–120 billion annually, is lost to the economy. A staggering 32% of plastic packaging escapes collection systems, generating significant economic costs by reducing the productivity of vital natural systems such as the ocean and clogging urban infrastructure. The cost of such after-use externalities for plastic packaging, plus the cost associated with greenhouse gas emissions from its production, is conservatively estimated at $40 billion annually – exceeding the plastic packaging industry’s profit pool. In future, these costs will have to be covered. In overcoming these drawbacks, an opportunity beckons: enhancing system effectiveness to achieve better economic and environmental outcomes while continuing to harness the many benefits of plastic packaging. The “New Plastics Economy” offers a new vision, aligned with the principles of the circular economy, to capture these opportunities. With an explicitly systemic and collaborative approach, the New Plastics Economy aims to overcome the limitations of today’s incremental improvements and fragmented initiatives, to create a shared sense of direction, to spark a wave of innovation and to move the plastics value chain into a positive spiral of value capture, stronger economics, and better environmental outcomes. Visit source. View report.
🌱 Nutrient
NRDC: The Nitrogen Pollution Crisis (2026)
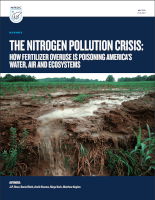
Fertilizing crops with nitrogen made modern agriculture possible by replenishing nutrients in the soil and increasing crop yields. But this important tool is now routinely overused. In fact, studies across multiple states show that many farmers apply significantly more nitrogen than is recommended by land grant universities while making limited use of practices minimizing nitrogen runoff. As a result, nearly half of the nitrogen fertilizer applied to croplands is not even used by plants; instead it washes into rivers and groundwater or is released into the air. In some places and for certain crops, the proportion rises to more than half. This lost nitrogen is not harmless. Nitrate-contaminated groundwater has been linked to blue baby syndrome, certain cancers, and thyroid disorders, while gaseous nitrogen emissions contribute to fine-particle air pollution and smog precursors that exacerbate asthma and other respiratory diseases. Excess nitrogen can devastate aquatic ecosystems by fueling harmful algal blooms and creating low-oxygen “dead zones” that suffocate aquatic life. And it contributes to the climate crisis through emissions of nitrous oxide (N₂O), a greenhouse gas roughly 273 times more effective at trapping heat than carbon dioxide. Nitrogen mismanagement costs the U.S. economy billions of dollars, shouldered predominantly by rural and low-income communities. Nitrogen fertilizer (defined in this report as either synthetic nitrogen fertilizer or manure) can account for a small or large share of a farm’s operating budget, depending on the crop grown. But the 40 to 60 percent of applied nitrogen that crops don’t use is more than just an unnecessary expense for farmers, especially when it comes to water pollution. Visit source. View report.
EIP: Plastic’s Toxic River (2024)
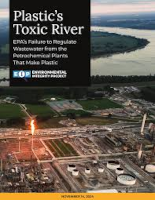
Environmental harm from plastics is widespread throughout its lifecycle – from the extraction, transportation, and refining of the raw fossil-fuel ingredients, to the manufacturing of plastic products, to the management of waste Despite this increasingly harmful footprint, plastics manufacturers have mostly escaped having to use modern pollution controls to clean wastewater before it is dumped into waterways. Though federal rules limit some pollutants, many harmful chemicals released by plastics manufacturers are completely unregulated by the U.S. Environmental Protection Agency (EPA) – including contaminants that scientists have identified as carcinogenic or otherwise harmful to human health. These include dioxins, which are known cancer-causing agents that are highly toxic and persist in the environment; and 1,4-dioxane, a likely carcinogen that EPA scientists recently indicated is threatening drinking water sources. Nitrogen and phosphorus pollution discharged from plastics and petrochemical plants – which cause algal blooms and fish-killing low-oxygen zones – are also not controlled by EPA’s industrial wastewater rules. Although state agencies can set limits for these pollutants in individual wastewater discharge permits, practices vary across states and the limits are inadequate and inconsistent. Visit source. View report.
UK: Nitrogen: time to reduce, recycle, reuse (2024)
Agriculture, wastewater, and transport and industry are the main contributors to nitrogen pollution in England and therefore are the focus of this report. Nitrogen fertiliser run-off into water and leaching into soil, as well as wastewater outflows of sewage, are significant sources of excess reactive nitrogen and progress in reducing nitrogen pollution from agriculture and wastewater has been slower than other sectors in recent decades. This is partly because the Government has historically taken a piecemeal approach to nitrogen management and regulation, with different Government departments addressing individual parts of the problem in siloes. This piecemeal approach has led to a largely ineffective regulatory framework, with poor enforcement, lack of clear accompanying guidance, and overlap between regulatory bodies’ remits which have complicated roles and responsibilities. We heard that farmers face a particularly complex and confusing regulatory landscape, with insufficient guidance and support, at a time when they are being asked to meet ever more requirements and demands, while still providing home-grown food on the table. Water quality is also a victim of an ineffective regulatory system, with ‘good’ ecological status being achieved in only 16 per cent of water bodies in England, a far cry from the Government’s target of 75 per cent. Visit source. View report.
EIP: The Fertilizer Boom (2023)
Based on the capacity of these new plants and expansions announced to date, when taken together, the total proposed production capacity in the U.S. of ammonia for both fertilizer and non-fertilizer could nearly triple, from 20 million metric tons to 57 million metric tons per year. This expansion could produce more than 54 million tons of greenhouse gases per year – as much as from 13 coal-fired power plants. There is no question that nitrogen fertilizer provides a tremendous benefit to society by boosting the production of food to feed billions of people around the world, including in developing nations. Chemical fertilizer empowers farmers to grow more corn, soybeans, and many other crops that are a staple of the global diet. But the over-application of chemical fertilizers also carries a cost for the environment, and that harm increases when the manufacture of the chemicals is poorly regulated. The impacts of the industry include water, air, and greenhouse gas pollution, and these costs can grow as the industry expands. Nitrogen fertilizer is a product that is routinely over applied to farm fields and lawns, running off into waterways, feeding algal blooms and low-oxygen “dead zones.” In nearly four decades, the U.S. Environmental Protection Agency (EPA) has not updated its technology-based standards for water pollution control systems at fertilizer manufacturing plants, even though the agency is required by law to do so regularly. The outdated and weak 1980s-era standards in place today contributed to an estimated 7.7 million pounds of nitrogen pollution – including 3.9 million pounds of toxic ammonia – that fertilizer plants piped into U.S. waterways in 2021. That’s as much nitrogen pollution as from 62 municipal sewage treatment plants. An expansion of the industry could add significant pollution to local waterways. Visit source. View report.
EPA: Life Cycle and Cost Assessments of Nutrient Removal Technologies in Wastewater Treatment Plants (2023)
Human-caused nutrient enrichment of waterbodies from excessive nitrogen (N) and phosphorus (P) is one of the most pervasive environmental issues facing the United States (U.S. EPA, 2015a). In many watersheds, municipal and industrial wastewater treatment plants (WWTPs) can be major point sources of nutrients. Recent efforts to derive numeric nutrient criteria to protect the designated uses of waterbodies have resulted in limits that may be challenging to meet for most WWTPs in the United States with the treatment configurations currently in place. However, many stakeholders have expressed concern that there may be significant undesirable environmental and economic impacts associated with upgrading treatment configurations, as these configurations may require greater use of chemicals and energy, release more greenhouse gases, and generate greater volumes of treatment residuals for disposal. The impacts can be assessed using holistic, systematic approaches using life cycle impact assessment (LCIA) and life cycle cost analysis (LCCA). These approaches provide a “cradle-to- grave” analysis of the environmental impacts and benefits as well as the economic costs and benefits associated with individual products, processes, or services throughout their life cycle. This study used LCIA and LCCA approaches to assess cost, human health, and ecosystem metrics associated with nine distinct wastewater treatment configurations designed to reduce the nutrient content of effluent from municipal WWTPs. Visit source. View report.
Planet Tracker: Fixing Nitrogen (2023)
Despite a lack of publicity, nitrogen plays a vital planetary role, ranging from the impact it has on food production to being a driver of pollution for land, sea and air. Nitrogen affects one of the nine planetary boundaries – biogeochemical flows. These limits need to be respected to avoid threatening the Earth’s ecosystems and maintaining its biosphere. Presently, the nitrogen boundary has been exceeded by at least two times. When considering nitrogen, we should be mindful of two limits. There is a maximum environmental limit of nitrogen fertiliser that should be used to avoid the consequences of significant environmental changes, but also a minimum social limit to provide enough food to feed the global population. For the financial markets, nitrogen is important. The fertiliser sector is an important industry in its own right, evident in both trade flows and for various corporates, as producers and/or users. It is a crucial input for the USD 14 trillion global food system affecting both costs and efficiency measures. Nitrogen fertiliser can cause costly pollution issues, damaging soils, water ecosystems and the oceans. These environmental costs can impact agriculture, tourism, aquaculture, fishing, as well as insurance and healthcare providers, and the financiers of these businesses It also impacts climate change by both using fossil fuels in its production and by emitting nitrous oxide, which is 310 times as powerful as carbon dioxide. Visit source. View report.
SACEP: Nitrogen Pollution In South Asia (2022)
This report provides an assessment of South Asia nitrogen emission trends and drivers, and a unique assessment of 966 nitrogen-related policies, valid in 2019, from South Asia. Human interventions that convert nitrogen to its reactive form (Nr) have been essential for sustaining the global population. Whilst nitrogen is essential for life, excess Nr can cause catastrophic harm to people and the environment. Activities such as agriculture, transport, industry, energy production, sewage processing, and waste management have contributed to excessive Nr, impacting water and air quality, the climate, ecosystems, and soil. South Asia (Afghanistan, Bangladesh, Bhutan, India, Maldives, Nepal, Pakistan and Sri Lanka) is a major global nitrogen emission hot spot. Therefore, how nitrogen is managed in South Asia has global implications. Sustainable nitrogen management would contribute to the attainment of all 17 of the UN Sustainable Development Goals (SDGs). South Asia has been among the earliest to recognise the nitrogen threat and to act to mitigate it. This report, along with an open access South Asia nitrogen-relevant policy database, provides a valuable resource for policy makers in South Asia and the global scientific community. Visit source. View report.
UKCEH: Our Phosphorus Future (2022)
Unsustainable phosphorus use is at the heart of many societal challenges. Unsustainable phosphorus use affects food and water security, freshwater biodiversity and human health. Increasing demand for food to support a growing global population continues to drive increases in phosphorus inputs to the food–system, as well as losses from land-based sources to freshwater and coastal ecosystems. These losses cause ecological degradation through the proliferation of harmful algal blooms in fresh waters, contributing to alarmingly high rates of biodiversity decline, economic losses associated with clean-up, and large-scale human health risks from contaminated drinking water supplies. The global anthropogenic phosphorus cycle is unsustainable. Phosphate rock is a non-substitutable, non-renewable natural resource, essential for fertilisers and animal feeds, and so for global food security. Phosphorus is also important in smaller quantities in industrial applications. Phosphorus emissions throughout agriculture, food and sewage systems are predicted to increase under global business-as-usual scenarios. The sources of emissions differ significantly between regions. Whilst agricultural systems vary, poor phosphorus management is widespread. Estimated losses of phosphorus from agriculture to surface waters account for about 34% of global fertiliser use (~5 Mt phosphorus year-1) representing 56% of all terrestrial inputs to surface waters. In some regions, including parts of Africa and India, wastewaters are the dominant source of phosphorus emissions with wastes often discharged directly to rivers with no treatment. Globally, ~80% of all wastewaters are discharged without treatment (in low-income countries ~8% are treated, in high- income countries ~70% are treated). Visit source. View report.
WWF-UK: Nitrogen: Finding the Balance (2022)
Nitrogen (N) is a naturally abundant element and forms nearly 80% of the Earth’s atmospshere as the inert gas di-nitrogen (N2), indeed being primarily responsible for the sky appearing blue. However, reactive nitrogen compounds (Nr) – chemically active forms of nitrogen that interact with the environment and support plant growth – are typically scarce in the natural environment. Since the 1960s, human use of synthetic Nr fertilisers has increased 9-fold globally and a further substantial increase of around 40-50% is expected over the next 40 years based on current trends. Together with increased fossil fuel combustion, humans have now created excess Nr pollution that spans all environmental compartments with multiple threats, to the extent that the disruption of the natural nitrogen cycle is now one of the greatest global threats to the environment of the 21st century. Key N threats and estimates for the UK include: Reductions in biodiversity (i.e. degradation of sensitive habitats) - the area of N-sensitive habitats in the UK with exceedance of nutrient N critical loads was 57.6% (42,049 km2) in 2017; Accelerated climate change via the production of nitrous oxide gas (N2O) – representing 5% of UK GHG emissions in 2019; Widespread air pollution leading to growing incidences of upper respiratory disease and cancer in humans, including the role of oxidized N in tropospheric (ground-level) ozone formation (a potent GHG that can also impact on human health and crop yields) - current estimate of the mortality burden of air pollution in the UK is equivalent to nearly 29,000 deaths and an associated loss of 340,000 life years across the population annually of which nitrogen oxide (NOx) and ammonia (NH3) pollution plays a sig nificant role (FR Section 1.1.2); Depletion of stratospheric ozone layer via the production of nitrous oxide gas (N2O); Eutrophication of aquatic ecosystems and hypoxic “dead zones” in the coastal ocean – around 55% of England in 2019 was designated as a Nitrate Vulnerable Zone (NVZ) due primarily to elevated nitrate concentrations in groundwater and rivers; in England, only 16% of water bodies meet the criteria for ‘good’ ecological status, 50% and 40% of water bodies achieve good status in Scotland and Wales respectively; Acidification of soils and forests of natural ecosystems - the area of acid-sensitive habitats in the UK with exceedance of acidity critical loads was 38.8% (27,253 km2 ) in 2017. Visit source. View report.
EPA: Innovative Nutrient Removal Technologies (2021)
The water and wastewater industry is facing significant challenges in its ability to maintain safe and sustainable water resources. These challenges include decreased availability and quality of water resources, population growth, emerging contaminants, aging infrastructure, and impacts of climate change related to precipitation, temperature, and flooding. Other challenges include changing workforce dynamics and the need to enhance workforce retention, recruitment, and development. In addition, challenges related to costs associated with meeting water quality objectives, coupled with declining water consumption and associated decline in water revenue at some facilities, are resulting in significant economic challenges for utilities…Nutrient control has been required at some municipal treatment plants for many years. In the last few years, there has been an increased interest amongst industry stakeholders in innovative nutrient removal technologies. This interest is driven by a number of factors. These include the need to renew aging infrastructure originally constructed in response to the 1972 Clean Water Act, the emergence of new and highly sustainable treatment approaches and practices, a paradigm shift in the industry’s view that wastewater is a resource and not a waste, and increasingly stringent effluent nutrient standards implemented across the U.S. to mitigate eutrophication by managing nitrogen and/or phosphorus. Many States have adopted or are now planning to adopt nutrient criteria into their water quality standards and are considering lowering nutrient limits in renewing discharge permits. Visit source. View report.
UNEP: Desk Review on Nutrient Pollution as a Regional and Transboundary Challenge in the East Asian Seas Region (2021)
Nitrogen (N) and phosphorus (P) are essential for all living things. In aquatic ecosystems, they support the growth of algae and aquatic plants that provide food and habitat for fish, shellfish and smaller organisms that live in waterbodies. However, when the coastal and marine environments contain too much N and P, the waters can become polluted. In the East Asian Seas region, chemical fertiliser use, demand for food, industrialisation, and population growth have increased, resulting in the use and discharge of N and P compounds to create more incidences of pollution. The main sources of N and P in the region come from agriculture, domestic, and industrial waste, with unsustainable aquaculture as a source in some countries. Sea-based sources of pollution such as from improper ship waste, ballast water discharge, and port operations also contribute to pollution. N and P on land are transported to the coastal and marine areas mainly via rivers, where they are taken up by aquatic organisms, deposited into sediments or remain floating in the water column. The impacts of eutrophication in the region include harmful algal blooms, health hazards to aquatic organisms and human beings, fish and shellfish death, and loss of economic revenue and livelihoods. Hotspots and areas observed to have high concentrations of N and P are found in river mouths, bays, and coastal areas consisting of large cities and industrial areas. Visit source. View report.
UNEP: Frontiers: Emerging Issues of Environmental Concern (2019)
The UNEP 2014 Year Book highlighted the importance of excess reactive nitrogen in the environment. Its conclusions are alarming. This is not just because of the magnitude and complexity of nitrogen pollution, but also because so little progress has been made in reducing it. Few of the solutions identified have been scaled up, while the world continues to pump out nitrogen pollution that contributes significantly to declines in air quality, deterioration of terrestrial and aquatic environments, exacerbation of climate change, and depletion of the ozone layer. These impacts hinder progress toward the Sustainable Development Goals as they affect human health, resource management, livelihoods and economies. Yet there are signs of hope. The past four years have seen a transformation in approaches to managing nitrogen pollution. These include new thinking for both consumption and production in order to seriously address the nitrogen problem…Both the cycling of nitrogen compounds and the human impacts are well documented. Yet compared with the role of carbon in climate change, there has been little public debate about the need to take action on nitrogen. The increased levels of Nr compounds in the air above cities and above agricultural areas are measurable, for example as NOX, NH3 and fine particulate matter, or PM2.5. Elevated levels of NO3 - in groundwater under agricultural areas in several regions around the world and in rivers downstream of cities with little or no sewage treatment are equally quantifiable. Atmospheric concentrations of the greenhouse gas N2O are accumulating at an accelerating rate. The clear message is that humans are massively altering the global nitrogen cycle, causing multiple forms of pollution and impacts, making Nr a key pollutant to tackle, from local to global scales. Visit source. View report.
UNEP: Year Book: Emerging issues in our global environment (2014)
Nitrogen is an essential nutrient for plant growth. The discovery a century ago of an industrial process that converted nitrogen in the air to ammonia made the manufacture of nitrogen fertilizers possible. This discovery was followed by a spectacular increase in global food production. Today nitrogen and other nutrients are used inefficiently in most of the world’s agricultural systems – resulting in enormous and largely unnecessary losses to the environment, with profound impacts ranging from air and water pollution to the undermining of important ecosystems (and the services and livelihoods they support). Such impacts are often more visible in developed regions than in developing ones. The global nitrogen cycle has been profoundly altered by human activity over the past century. The amount of usable or ‘reactive’ nitrogen produced by humans (about 160 million tonnes per year) is now greater than the amount created through natural processes (90-120 million tonnes per year). In addition to inefficient application of nitrogen fertilizers, sources of excess nitrogen in the environment are inadequately treated animal and human wastes and fossil fuel combustion in transport and in energy production, which creates nitrogen oxides. As nitrogen moves through the environment, the same nitrogen atom can contribute to multiple negative effects in the air, on land, in freshwater and marine systems, and on human health. This sequence continues over a long period and is referred to as the ‘nitrogen cascade’.. Visit source. View report.
HBRF: Nitrogen Pollution: From The Sources To The Sea (2003)
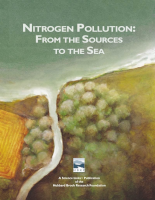
Over the past century, human activity has greatly increased the amount of nitrogen pollution in the environment. Human sources of reactive nitrogen in the Northeastern U.S (the Northeast) are dominated by airborne nitrogen emissions that are deposited on the Earth, nitrogen in food and nitrogen fertilizer. Excess reactive nitrogen in the environment has given rise to a cascade of pollution problems across the Northeast. Fortunately, several policy options exist for reducing nitrogen pollution and its effects…The three largest sources of reactive nitrogen to the Northeast are nitrogen in food, airborne nitrogen emissions and nitrogen fertilizer…Nitrogen pollution contributes to ground-level ozone, acid rain and acidification of soil and surface waters, disruption of forest processes, coastal over-enrichment and other environmental issues…Controls on vehicle and utility emissions of nitrogen oxides produce the largest reductions in airborne nitrogen pollution in the Northeast…Nitrogen removal from wastewater at a basin-wide scale is the single most effective means of reducing nitrogen loading to estuaries in the Northeast…Nitrogen pollution is steadily increasing and has emerged as a pressing environmental issue of the 21 st century. Visit source. View report.
🌳 Resources
UNU-INWEH: Environmental Cost of AI’s Energy Use (2026)
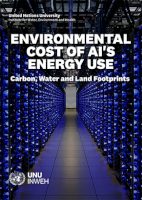
Artificial intelligence (AI) has become a defining technology of the Fourth Industrial Revolution, moving societies beyond digitization toward the optimization and automation of complex systems. AI systems that learn, perceive, reason, and generate content are now embedded across economies and daily lives, supporting services from translation and recommendations to finance, healthcare, energy management, and transportation…When a technology scales this quickly, unintended social, economic, geopolitical, and environmental consequences can accumulate quietly and then become complex and inequitable to correct once systems, investments, and dependencies lock in. Public debate has rightly focused on AI risks such as bias, privacy, disinformation, labor disruption, and inequity. Yet, one of the most consequential dimensions of AI that remains comparatively underexamined is its environmental footprint and the justice implications that follow from where and how AI infrastructure expands. AI is not “just code”; it also involves physical infrastructure and supply chains, including data centers, chips, electricity generation, cooling systems, water withdrawals, land occupation, critical minerals, and eventual e-waste…The investigation goes beyond the carbon-only lens that typically dominates the conversation. It examines AI’s indirect environmental footprints through energy use, quantifying the carbon, water, and land footprints associated with generating the electricity required to operate AI at scale, and highlighting how outcomes vary substantially by location depending on electricity supply mixes…AI hardware relies on critical minerals whose extraction and processing can cause environmental and social harms, often concentrated in the Global South and in places with weak oversight. At end of life, poorly managed e-waste can expose frontline communities to hazardous substances. By 2030, AI infrastructure could generate up to 2.5 million metric tons of e-waste each year, roughly equivalent to discarding 250 Eiffel Towers annually. These impacts show that responsible AI requires full value-chain governance, from mineral sourcing to recycling and safe disposal. Visit source. View report.
UNU-INWEH: Global Water Bankruptcy (2026)

The central message of this report is direct: the world has entered the era of Global Water Bankruptcy. In many regions, human–water systems are already in a post-crisis state of failure. Over decades, societies have withdrawn more water than climate and hydrology can reliably provide, drawing down not only the annual “income” of renewable flows but also the “savings” stored in aquifers, glaciers, soils, wetlands, and river ecosystems. At the same time, pollution, salinization, and other forms of water quality degradation have reduced the fraction of water that is safely usable. The consequences of water bankruptcy are now visible on every continent: rivers that no longer reach the sea; lakes, wetlands, and glaciers that have shrunk or disappeared; aquifers pumped down until land subsides and salt intrudes; forests and peatlands drying and burning; deserts and dust storms expanding, and cities repeatedly brought to the brink of “Day Zero.” These are not simply signs of stress or episodes of crisis. They are symptoms of systems that have overspent their hydrological budget and eroded the natural capital that once made recovery possible, with knock-on effects for food prices, employment, migration and geopolitical stability. The report calls for the recognition of the state of ‘Water bankruptcy’ as a persistent post-crisis condition of a human–water system in which longterm water use has exceeded renewable inflows and safe depletion limits, causing irreversible or effectively irreversible degradation such that previous levels of water supply and ecosystem functions cannot realistically be restored. Visit source. View report.
Circle Economy: Circularity Gap Report 2025
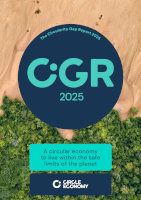
The economic system should deliver maximum possible wellbeing within the safe limits of our planet. After seven years of reporting, our message remains much the same: in the face of escalating global challenges, the circular economy offers a means to rewire the entrenched linear practices that no longer serve most people or the planet…The Circularity Metric continues to decline: the vast majority of materials entering the economy are virgin, with the share of secondary materials falling from 7.2% to 6.9% as of the latest analysis…Ongoing declines in circularity can largely be tied to sustained growth in material use. Although the absolute scale of secondary material consumption is slowly trending upwards, this is being outpaced by growth in virgin material use. Global extraction has more than tripled in the last fifty years, recently reaching a landmark 100 billion tonnes—and without ‘bending the trend’, this is set to rise by a further 60% by 2060…A truly circular economy should be resource-light: without profoundly rewiring systems of production and consumption and applying structural changes across key systems—from housing and food to mobility and manufacturing—we will not be able to close the loop on material consumption. Visit source. View report.
GCEW: The Economics of Water (2024)
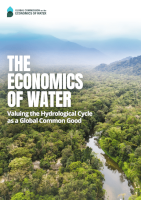
The world faces a growing water disaster. For the first time in human history, the hydrological cycle is out of balance, undermining an equitable and sustainable future for all. We can fix this crisis if we act more collectively, and with greater urgency. Vitally too, restoring stability of the water cycle is critical not only in its own right, but to avoid failing on climate change and safeguarding all the earth’s ecosystems, as well as on each and every one of the Sustainable Development Goals (SDGs). It will preserve food security, keep economies and job opportunities growing, and ensure a just and liveable future for everyone. Decades of collective mismanagement and undervaluation of water around the world have damaged our freshwater and land ecosystems and allowed for the continuing contamination of water resources. We can no longer count on freshwater availability for our collective future. More than 1,000 children under five die every day from illnesses caused by unsafe water and sanitation. Women and girls spend 200 million hours each day collecting and hauling water. Food systems are running out of fresh water, and cities are sinking as the aquifers underneath them run dry. We have, fundamentally, put the hydrological cycle itself under unprecedented stress, with growing consequences for communities and countries everywhere. Our policies, and the science and economics that underpin them, have also overlooked a critical freshwater resource, the “green water” in our soils and plant life, which ultimately circulates through the atmosphere and generates around half the rainfall we receive on land. Visit source. View report.
EPA: National Rivers and Streams Assessment (2024)
Clean and healthy rivers and streams enhance the quality of our lives. They supply our drinking water, irrigate our crops, provide highways for shipping, and offer us recreation. They support aquatic life and provide shelter, food, and habitat for birds and wildlife. Rivers and streams shape America’s landscape. They are the land’s vast, interconnected circulatory system, carrying water from the mountains to the sea. Healthy habitat occurred in over half of our river and stream miles…Physical habitat indicator scores revealed that 68% of river and stream miles were rated good for in-stream fish habitat, 57% scored good for streambed sediment levels, and 56% of river and stream miles had good ratings for riparian vegetation (vegetation on or adjacent to the river or stream banks). However, 64% of river and stream miles had moderate or high levels of riparian disturbance. Less than one-third of our river and stream miles (28%) had healthy biological communities, based on an analysis of benthic macroinvertebrate communities. Biological condition was based on the abundance and diversity of benthic macroinvertebrates (bottom-dwelling invertebrates such as dragonfly and stonefly larvae, snails, worms, and beetles). Close to half of river and stream miles (47%) were in poor condition. Just over one-third (35%) of river and stream miles had healthy fish communities. Fish community health was based on fish abundance and diversity. Sixteen percent of river and stream miles were not assessed for fish. The remainder (49%) were in fair or poor condition. Nutrients (phosphorus and nitrogen) were the most widespread stressors. Forty-two percent of the nation’s river and stream miles were in poor condition, with elevated levels of phosphorus, and 44% were in poor condition for nitrogen. Poor biological condition was more likely when rivers and streams were in poor condition for nutrients. Reducing nutrient pollution could improve biological condition. NRSA analyses indicated that approximately 20% of the river and stream miles in poor biological condition could be improved if nutrient condition changed from poor to fair or good. The level of improvement was estimated to be similar regardless of nutrient and biological indicator analyzed. Visit source. View report.
EPA: National Wetland Condition Assessment (2024)
Healthy wetlands enhance our quality of life and provide many critical services and recreational opportunities. Wetlands are among the most productive ecosystems in the world, home to an immense variety of fish and wildlife. They trap pollutants, store carbon and buffer our shorelines from waves. Less than half of wetland area was rated good, based on an analysis of plant communities. The EPA calculated a vegetation indicator score by combining several metrics based on abundance and types of plant species into one value. The EPA found 45% of wetland area was in good condition. Nonnative plants were a widespread concern. Using an indicator based on the occurrence and abundance of nonnative plants, the EPA found less than half of wetland area, 48%, was rated as being in good condition, and 24% was rated poor or very poor. Physical alterations to wetlands were the most widespread stressors measured. The NWCA reports on six indicators of physical alteration, based on evidence of certain human activities at each site. These alterations directly affect vegetation, hydrology (water levels and the flow of water), or soil. The NWCA also measures the presence of multiple types of alterations at each site by combining the results of the six indicators. The combined indicator showed that 82% of wetland area was in fair or poor condition. Indicators for both vegetation replacement (for example, replacement of native vegetation with pasture or croplands) and vegetation removal (such as clearing or excessive grazing by livestock) showed 56% of wetland area was in fair or poor condition. The indicator for soil hardening (for example, soil compaction or hardened surfaces such as roads) showed fair or poor condition for 49% of wetland area. Nutrient levels were elevated for some wetlands. Nitrogen and phosphorus levels were measured at wetland sites where enough surface water was present to collect a water sample. Nitrogen and phosphorus conditions were found to be poor at 17% and 24% of wetland area, respectively. However, because many wetlands did not have surface water, 40% of wetland area could not be assessed for water chemistry. In wetlands where phosphorus and nitrogen were elevated, biological condition expressed by the nonnative plant indicator was 1.6 and 1.7 times more likely, respectively, to be rated poor or very poor. Visit source. View report.
UNEP: Global Resource Outlook (2024)
Increasing resource use is the main driver of the triple planetary crisis. Extraction and processing of material resources (fossil fuels, minerals, non-metallic minerals and biomass) account for over 55 per cent of greenhouse gas emissions (GHG) and 40 per cent of particulate matter health related impacts. If land use change is considered, climate impacts grow to more than 60 per cent, with biomass contributing the most (28 per cent) followed by fossil fuels (18 per cent) and then non-metallic minerals and metals (together 17 per cent). Biomass (agricultural crops and forestry) also account for over 90 per cent of the total land use related biodiversity loss and water stress. All environmental impacts are on the rise. Material use has increased more than three times over the last 50 years. It continues to grow by an average of more than 2.3 per cent per year. Material use and its impact continue to rise at a greater rate than increases in well-being (as measured by inequality- adjusted Human Development Index). The built environment and mobility systems are the leading drivers of rising demand, followed by food and energy systems. Combined, these systems account for about 90 per cent of global material demand. Material use is expected to increase to meet essential human needs for all in line with the Sustainable Development Goals (SDGs). Without urgent and concerted action to change the way resources are used, material resource extraction could increase by almost 60 per cent from 2020 levels by 2060, from 100 to 160 billion tonnes, far exceeding what is required to meet essential human needs for all in line with the SDGs…Compared to historical trends, it is possible to reduce resource use while growing the economy, reducing inequality, improving well-being and dramatically reducing environmental impacts. Scenario modelling illustrates the potential to reduce and rebalance global per capita material use, with absolute reductions from around 2040 driven by reductions in high and upper middle-income nations that outweigh, in aggregate, increases in low and lower middle-income nations. The policies and shifts that could drive these change also reduce economic inequalities and boost global income growth. Visit source. View report.
EIP: The Aluminum Paradox (2023)
As climate change accelerates, aluminum has taken a lead position in the race for a lower- carbon, less polluting industrial future. Lightweight and durable, the metal is a key component in solar panels and wind turbines, more efficient cars and planes, and long- lasting construction materials. Given this, global aluminum demand is projected to be 40 percent higher in 2030 than in 2020.1 Yet the aluminum industry accounted for 1.2 billion tons of global greenhouse gases in 2021, the same amount as the energy used by over 150 million U.S. homes—and its contribution to climate change is only set to grow alongside demand.2 In addition, aluminum production causes air and water pollution that harms communities and the environment worldwide. For example, three U.S. production facilities (in Kentucky, Missouri, and New York) are a key reason why there is more sulfur dioxide (SO2 ) in the surrounding air than allowed by law, posing risks to respiratory and cardiovascular health. The refining of a raw material called alumina has generated over three billion tons of “red mud,” a toxic waste that puts people, soil, and groundwater at risk worldwide. Visit source. View report.
EIP: The Clean Water Act at 50 (2022)
This year will mark the 50th anniversary of the federal Clean Water Act of 1972. The law was a crowning achievement of the environmental movement, inspired in part by flames on the Cuyahoga River in Ohio, shame over sewage in the reeking Hudson, and rage over record-breaking fish kills in Lake Thonotosassa, Florida. The Act directed more than $1 trillion in investments into wastewater treatment plants and drove substantial improvements in water quality, especially in its first three decades.3 But the improvements slowed over time, and the landmark law, a half-century later, remains far from its ambitious goals of producing “fishable, swimmable” waters across the U.S. by 1983 and the complete elimination of pollution into America’s navigable waters by 1985 The Clean Water Act requires states to submit periodic reports on the condition of their rivers, streams, lakes, and estuaries to the U.S. Environmental Protection Agency. Based on the latest of those reports, about half of the river and stream miles and lake acres that have been studied across the U.S. are so polluted they are classified as “impaired.” That means they are too polluted to meet standards for swimming and recreation, aquatic life, fish consumption, or as drinking water sources. The same is true for a quarter of assessed bay and estuary square miles. These figures do not include many waterways where conditions remain unknown because they have not been examined recently. Visit source. View report.
UNCCD: Global Land Outlook (2022)
Land resources – soil, water, and biodiversity – provide the foundation for the wealth of our societies and economies. They meet the growing needs and desires for food, water, fuel, and other raw materials that shape our livelihoods and lifestyles. However, the way we currently manage and use these natural resources is threatening the health and continued survival of many species on Earth, including our own. Of nine planetary boundaries used to define a ‘safe operating space for humanity’, four have already been exceeded: climate change, biodiversity loss, land use change, and geochemical cycles. These breaches are directly linked to human-induced desertification, land degradation, and drought. If current trends persist, the risk of widespread, abrupt, or irreversible environmental changes will grow. Roughly USD 44 trillion of economic output – more than half of global annual GDP – is moderately or highly reliant on natural capital. Yet governments, markets, and societies rarely account for the true value of all nature’s services that underpin human and environmental health. These include climate and water regulation, disease and pest control, waste decomposition and air purification, as well as recreation and cultural amenities…Conserving, restoring, and using our land resources sustainably is a global imperative: one that requires moving to a crisis footing. At no other point in modern history has humanity faced such an array of familiar and unfamiliar risks and hazards, interacting in a hyper-connected and rapidly changing world. We cannot afford to underestimate the scale and impact of these existential threats. Rather we must work to motivate and enable all stakeholders to go beyond existing development and business models to activate a restorative agenda for people, nature, and the climate. Land restoration is essential and urgently needed. It must be integrated with allied measures to meet future energy needs while drastically reducing greenhouse gas emissions; address food insecurity and water scarcity while shifting to more sustainable production and consumption; and accelerate a transition to a regenerative, circular economy that reduces waste and pollution. Visit source. View report.
FAO: Global Assessment of Soil Pollution (2021)
Global environmental degradation due to pressures from the growing demands of agri-food and industrial systems, responding to a rising world population, is one of the major global challenges facing humanity. Thousands of different synthetic chemical compounds and naturally existing elements with potential toxicity have been released into the environment by human activities since ancient times. These contaminants can have residence times in the environment in the order of hundreds to thousands of years and are distributed throughout the planet. Pollution is a global problem that knows no borders. Contaminants are found in every continent even in their most remote areas, and are readily transported from one country to another. Soil is one of the main recipient of contaminants. Soil pollution is one of the main threats to soil health but its impacts go far beyond the soil dimension and soil contaminants can have irreparable consequences on human and ecosystem health. Polluted soil can act as a source of contaminants for all environmental compartments, including water, air, food, and organisms, including humans. Ecosystem and human health are interconnected, as the Planetary Health and One Health initiatives emphasize, yet neither can be effectively addressed without tackling soil pollution. Visit source. View report.
WWF: Thriving Within Our Planetary Means (2021)
Human activities are propelling the climate crisis, disrupting global biochemical cycles, degrading or converting species-rich natural ecosystems, causing chemical and plastic pollution, and inducing a decline in global biodiversity. Almost 75% of all ice-free land is significantly altered by human activities and animal populations have declined 68% since the 1970s. These impacts on the natural world – on which human society and wellbeing ultimately depend – are driven by overconsumption, unsustainable extraction rates, and by the methods we use to produce material goods. The science is unambiguous: we need to reduce the impact that our production and consumption has on the natural environment if we are to conserve biodiversity for its own intrinsic value and ensure that future human generations have access to sufficient resources to thrive. Doing so will require urgent, sustained, and transformative action to address how we produce and consume materials. Within this, we also need to recognize and address global inequalities: people living in high income countries consume more than thirteen times the quantity of materials per year than those in developing countries. As a major economy, the UK’s production and consumption has a disproportionate footprint on earth systems and biodiversity. In this report, we assess what it will take to reduce the UK’s production and consumption footprint to within sustainable boundaries…Based on this, and the fact that the UK’s contribution to a global target of halving must reflect its responsibility for the impacts and its capacity to address them, we conclude that a reasonable reduction to bring the UK’s impact on earth systems and biodiversity within sustainable limits whilst allowing some convergence in footprint by less developed nations would be a reduction in the UK’s footprint of production and consumption by at least three quarters. Visit source. View report.
OECD: Global Material Resources Outlook to 2060 (2019)
Global primary materials use is projected to almost double from 89 gigatonnes (Gt) in 2017 to 167 Gt in 2060. Non-metallic minerals – such as sand, gravel and limestone – represent the largest share of total materials use. These non-metallic minerals are projected to grow from 44 Gt to 86 Gt between 2017 and 2060. Metal use is smaller when measured in weight, but is projected to grow more rapidly and metal extraction and processing is associated with large environmental impacts. The strongest growth in materials use is projected to occur in emerging and developing economies. China remains the largest consumer, but the central baseline scenario projects a rapid stabilisation of steel and construction materials use in China. Other non-OECD countries – such as India, Indonesia, and most countries in Sub- Saharan Africa and Asia – are projected to undergo an economic and materials use growth spurt. Even in the OECD, where economic growth rates are more modest, materials use grows between 1% and 2% per year on average. The materials intensity of the global economy is projected to decline more rapidly than in recent decades – at a rate of 1.3% per year on average. This stems from the following trends: the global economy orients towards more services, technologies become more efficient, and the construction boom in China phases out. This decline in material intensity reflects a relative decoupling: global materials use increases, but not as fast as GDP. Recycling is projected to gradually become more competitive compared to extraction of primary materials, leading the recycling sector to outpace growth in mining. The strong increase in demand for materials implies that both primary and secondary materials use increase at roughly the same speed. The relatively high labour costs for secondary production technologies hampers further penetration of secondary materials, despite the competitiveness increases in recycling. Visit source. View report.
IPBES: Assessment Report on Land Degradation and Restoration (2018)
Land degradation is a pervasive, systemic phenomenon: it occurs in all parts of the terrestrial world and can take many forms. Combating land degradation and restoring degraded land is an urgent priority to protect the biodiversity and ecosystem services vital to all life on Earth and to ensure human well-being. Currently, degradation of the Earth’s land surface through human activities is negatively impacting the well-being of at least 3.2 billion people, pushing the planet towards a sixth mass species extinction, and costing more than 10 per cent of the annual global gross product in loss of biodiversity and ecosystem services…The main direct drivers of land degradation and associated biodiversity loss are expansion of crop and grazing lands into native vegetation, unsustainable agricultural and forestry practices, climate change, and, in specific areas, urban expansion, infrastructure development and extractive industry…Investing in avoiding land degradation and the restoration of degraded land makes sound economic sense; the benefits generally by far exceed the cost…Timely action to avoid, reduce and reverse land degradation can increase food and water security, can contribute substantially to the adaptation and mitigation of climate change and could contribute to the avoidance of conflict and migration. Visit source. View report.
🗑️ Waste
World Bank: What a Waste 3.0 (2026)
The world is at a critical juncture in managing its growing waste. Rapid population growth, accelerating urbanization, rising incomes, and increased consumption are driving a surge in municipal solid waste1 generation that is outpacing the capacity of local systems and municipal budgets. As a result, cities and communities worldwide are struggling to keep up with mounting quantities of waste. When waste is not managed well, the consequences are far reaching: environmental pollution intensifies, greenhouse gas (GHG) emissions rise, and valuable natural resources are wasted. These threaten public health and the environment and undermine economic development and the livability of cities. Yet, within the crises lies an opportunity. By investing in more efficient, inclusive, and sustainable waste management systems, countries can unlock new avenues for economic growth, job creation, and innovation. Improved waste management systems that embrace circular economy principles, where materials are reused and value is retained, can transform waste from a burden into a driver of sustainable development, benefiting both local communities and the global environment. Visit source. View report.
FAO: Tracking progress on food and agriculture-related SDG indicators 2025
The world has made no apparent progress in reducing food losses since 2015. Food losses impose a substantial economic, social and environmental toll, hampering efforts to improve food security and nutrition and reduce the impact of agriculture on land use, biodiversity loss, water stress and climate change. Nonetheless, the available data points to an overall stagnation, if not deterioration, in the progress to reduce food losses. The percentage of food lost globally after harvest on farm, transport, storage, wholesale and processing levels is estimated at 13.3 percent in 2023, up slightly from 13.0 percent in 2015, when global monitoring began. This marginal increase falls within the expected range of model oscillations and is primarily driven by updates to national production data and newly available or revised country-level estimates. As shown in Figure 33, slight increases in food loss levels were recorded across most regions between 2015 and 2023…At the global level, food loss patterns vary significantly by commodity group. As shown in Figure 35, fruits and vegetables account for the highest losses, increasing from 23.2 percent in 2015 to 25.4 percent in 2023, due to their high perishability and handling requirements. Meat and animal products remained relatively stable, rising slightly from 13.9 to 14.0 percent. Roots, tubers and oil-bearing crops decreased from 12.6 to 12.3 percent, while cereals and pulses saw a minor decline from 8.5 to 8.4 percent. There are currently no loss estimates for Fish and fish products. These differences reflect the perishability of different products, supply chain challenges and infrastructure constraints. Despite persistent data gaps at the country level, the continued high global and regional food loss levels call for accelerated investments in infrastructure, policy action, and improved data systems and targeted strategies to address post- harvest inefficiencies. Visit source. View report.
Global E-waste Monitor (2024)
The world is experiencing significant electronification, including a digital transformation, with technologies profoundly changing the way we live, work, learn, socialize and do business. Many people own and use multiple electronic devices, and the increasing interconnectivity of urban and remote areas has led to a rise in the number of devices and objects linked to the Internet. These include the usual computers and phones, but also a growing list of objects such as household appliances, e-bikes and e-scooters, health monitors, environmental sensors, electronics embedded in furniture and clothes, more and more toys and tools, and energy-saving equipment such as LEDs, photovoltaics and heat pumps. This growth has seen a concomitant surge in the amount of EEE and e-waste. When EEE is disposed of, it generates a waste stream that contains both hazardous and valuable materials, collectively known as e-waste, or waste electrical and electronic equipment (WEEE)…The rise in e-waste generation is therefore outpacing the rise in formal recycling by a factor of almost 5 - driven by technological progress, higher consumption, limited repair options, short product lifecycles, growing electronification and inadequate e-waste management infrastructure - and has thus outstripped the rise in formal and environmentally sound collection and recycling. Visit source. View report.
UN: Progress on the proportion of domestic and industrial wastewater flows safely treated (2024)
There is an alarming lack of countries’ reported wastewater statistics worldwide (Table 1) that could be addressed through the monitoring of SDG Indicator 6.3.1. However, the previous global SDG 6.3.1 progress report presenting the statistics reported by United Nations Member States shows that in 2015, national-level reporting on the proportion of total wastewater treated represented only 20 per cent of the world’s population; for the proportion of industrial wastewater treated, the figure was only 5 per cent of the world’s population (UN-Habitat and WHO, 2021). Across the 107 countries reporting some wastewater statistics for 2022 (representing 73 per cent of the world’s population) in the present report, the proportion of total wastewater receiving some level of treatment (76 per cent) could only be calculated for 73 countries (representing 42 per cent of the global population); whereas the proportion of total wastewater “safely” treated, i.e. at least secondary treatment (60 per cent), could only be calculated for 42 countries (representing 12 per cent of the population) (Table 1). These data are insufficient to establish global statistics on the proportion of total wastewater treated and safely treated…Globally, an estimated 268 billion m3 of household wastewater was generated in 2022, of which 155 billion m3 (58 per cent) was estimated to have been collected, delivered to treatment and safely treated and discharged. While the proportion of household wastewater safely treated in 2022 is slightly higher than that previously reported for 2020 (56 per cent), trends on the indicator remain inconclusive until estimates are made over a longer time period. Additionally, the lack of data for a 2015 baseline estimate inhibits the assessment of progress towards Target 6.3 (halving the proportion of untreated discharges by 2030). Visit source. View report.
UNEP: Food Waste Index (2024)
Food waste is a market failure that results in the throwing away of more than US$1 trillion worth of food every year. It is also an environmental failure: food waste generates an estimated 8–10 per cent of global greenhouse gas emissions (including from both loss and waste), and it takes up the equivalent of nearly 30 per cent of the world’s agricultural land. The conversion of natural ecosystems for agriculture has been the leading cause of habitat loss. Just as urgently, food waste is failing people: even as food is being thrown away at scale, up to 783 million people are affected by hunger each year, and 150 million children under the age of five suffer stunted growth and development due to a chronic lack of essential nutrients in their diets…In 2022, the world wasted an estimated 1.05 billion tonnes of food in the retail, food service and household sectors combined. This amounts to 132 kilograms per capita per year, of which 79 kilograms per capita was wasted in households…In households alone, this means that each person, on average, wastes significantly more than the average mass of an adult human per year, with food waste from retail, food service and households weighing more than twice the average human…This amounts to 19 per cent of food available to consumers being wasted, at the retail, food service and household levels. This is in addition to the estimated 13 per cent of the world’s food that is lost in the supply chain from post-harvest up to and excluding retail…A small number of countries are demonstrating progress towards halving food waste by 2030. Measuring food waste enables countries to understand the scale of the problem, target interventions and track change. All countries should seize this opportunity, especially middle-and lower-income countries where data coverage is lower and potential gains are substantial. Visit source. View report.
UNEP: Global Waste Management Outlook (2024)
Every year across the globe more than two billion tonnes of municipal solid waste (MSW) is generated. If packed into standard shipping containers and placed end-to-end, this waste would wrap around the Earth’s equator 25 times, or further than traveling to the moon and back. As well as municipal waste, human activity generates significant amounts of agricultural; construction and demolition; industrial and commercial; and healthcare waste. This waste is produced on farms and building sites and in factories and hospitals. Municipal waste is generated wherever there are human settlements. It is influenced by each person in the world, with every purchasing decision, through daily practices and in the choices made about managing waste in the home. The way people buy, use and discard materials determines the amount of energy and raw materials used and how much waste is generated. Municipal waste is thus intrinsically linked to the triple planetary crisis of climate change, pollution and biodiversity loss. The first Global Waste Management Outlook (GWMO), published in 2015, provided a pioneering scientific global assessment of the state of waste management. It was also a call to action to the international community to recognise waste and resource management as a significant contributor to sustainable development and climate change mitigation. Since then, despite some concerted efforts, little has changed. If anything, humanity has moved backwards - generating more waste, more pollution and more greenhouse gas (GHG) emissions. Billions of tonnes of municipal waste is still being generated every year, and billions of people still don’t have their waste collected. Uncontrolled waste knows no national borders. It is carried by waterways across and between countries, while emissions from the burning and open dumping of waste are deposited in terrestrial and aquatic ecosystems and in the atmosphere. Pollution from waste is associated with a range of adverse health and environmental effects, many of which will last for generations. Visit source. View report.
World Bank: Results-Based Financing for Solid Waste Management (2024)
Achieving a livable planet is contingent on how global waste is generated and treated. Driven by economic growth and rapid urbanization, global waste generation is expected to increase 73 percent by 2050 (Kaza, Shrikanth, and Chaudhary 2021). This problem is especially acute in low- and middle-income countries (LMICs) in Africa and South Asia. In Africa alone, waste generation will triple by 2050, reaching 600 million tonnes per year. Moreover, waste management practices are often unsustainable and inadequate to cope with this rapidly increasing volume of waste. About 27 percent of global waste goes uncollected and, in low-income countries, waste mismanagement is widespread, with 93 percent of waste either dumped or burned, adversely affecting the environment and human health (UNEP 2024; Kaza et al. 2018). The World Bank is committed to laying the foundations for building sustainable solid waste management (SWM) systems. According to the Bank’s 2019 lending portfolio review, US$290 million is directed annually toward the SWM sector, 1 with an average expenditure of US$29 million per project (World Bank 2020c). The common objective of these investments is to reduce environmental and health risks by enhancing SWM systems. To achieve this objective, the investment projects deploy various financing instruments with technical designs tailored to local needs to offer effective solutions. In particular, the projects seek to address at least one of several bottlenecks to sustainable SWM systems: unclear governance structure, inadequate financing mechanisms, and limited access to quality SWM infrastructure and services. Despite such efforts, more work is needed to achieve functional and sustainable SWM systems in LMICs. Visit source. View report.
EIP: Trashing The Climate (2023)
Municipal landfills are one of the largest sources of methane in the United States, responsible for an estimated 14.3 percent of total methane emissions. When organic components of municipal solid waste such as food scraps, yard trimmings, and paper break down in landfills, they generate methane. EPA estimates that U.S. municipal waste landfills emitted a total of 3.7 million metric tons of methane in 2021, equivalent to about 295 million metric tons of greenhouse gases (carbon dioxide equivalent, or CO2e tons), if the effects of methane are evaluated on a 20- year timeline. This is as much greenhouse gas pollution as from 66 million gasoline-powered passenger vehicles on the road for a year (about a quarter of all American cars, SUVs, vans, and pickup trucks), or from 79 coal-fired power plants. Methane is one of the most potent greenhouse gases, trapping about 80 times as much heat as carbon dioxide over 20 years. Reducing methane from landfills therefore presents an opportunity to significantly reduce greenhouse gas emissions in the face of climate change, through actions like installing landfill methane collection systems and reducing and composting food waste. Food waste, in particular, is a growing problem that can be addressed…The necessary solutions to the landfill methane problem include discouraging food waste by consumers and businesses and encouraging more composting and recycling of waste. Also needed are federal regulations that require the installation of gas collection systems and monitors at landfills, as well as covering materials on landfills that help contain emissions. Visit source. View report.
UN Habitat: Global Report on Sanitation and Wastewater Management in Cities and Human Settlements (2023)
Sanitation and wastewater management are core to the health and wellbeing of individuals, cities, societies and whole environmental ecosystems. But halfway through the SDG era, and despite being a public good, sanitation continues to lag behind. Governments and intergovernmental organizations still lack critical data on the status of wastewater and faecal sludge treatment, both globally and at the country level. There is a need for greater clarity, and better guidance, on what a public service approach to sanitation involves in practice. There are many cities across regions taking effective measures to improve sanitation — but guidance is needed to make universal access a reality. Drawing on a mapping of 18 cities across Africa, Asia, Europe and Latin America, this report aims to raise awareness of the critical importance of sanitation in human and urban development. Its target is to shed light on the current situation and the state-of-the-art globally, with specific reference to wastewater and faecal sludge management; and to provide decision makers with guidance on the level and types of action required to drive change. Poor sanitation and wastewater management is devastating for human health. Untreated wastewater leads to disease such as diarrhoea, cholera, dysentery, typhoid, and polio, and wider infections which can contribute to malnutrition and long term cognitive impairment. A wide range of pollutants present in wastewater such as nitrogen, pathogens, heavy metals, and emerging contaminants like EDCs pose serious health risks to communities and consumers of wastewater irrigated crops. Sanitation workers such as manual pit emptiers are among groups particularly at risk of sanitation-related disease. Beyond human health, disposal of untreated wastewater and faecal sludge into the environment is a significant threat to life below water and life on land. Poor wastewater management has a plethora of impacts on coastal ecosystems, leading to eutrophication, declining of fisheries, habitat loss and degradation. Freshwater systems are particularly susceptible to sewage pollution because of their proximity to human settlements. Visit source. View report.
UNEP: Wastewater - Turning Problem to Solution (2023)
More than 10 years have passed since the release of the report Sick Water? The Central Role of Wastewater Management in Sustainable Development – A Rapid Response Assessment report (“the Sick Water? report”), and despite some progress, significant amounts of wastewater are still being released untreated into the environment. Untreated wastewater is one of the key drivers of biodiversity loss and a major threat to human health, particularly affecting the most vulnerable people and ecosystems. But when adequately treated, wastewater can become a valuable resource…Out of sight cannot be out of mind when it comes to wastewater. Wastewater is used water, something people produce every day, no matter who or where they are. It is produced in large quantities and then forgotten about. Ignoring this important resource would be a mistake that undermines our reliance on finite water supplies. It is time to transform how we see wastewater, from a smelly and dangerous source of pollution, improperly managed, having severe negative impacts on environmental and human health, to a well-managed and valued resource carrying huge potential as a source of clean water, energy, nutrients and other materials. This resource could help provide sustainable solutions to address the worsening environmental and societal crises, many rooted in water shortages, that contribute to food insecurity and undermine ecosystems. Only 11 per cent of the estimated total of domestic and industrial wastewater produced is currently being reused. Given the world’s worsening water and food and energy security crises, we cannot afford to waste a drop…Elevating the reuse of resources from wastewater in the international policy agenda is critical to tackling the triple planetary crisis of climate, nature and pollution. Visit source. View report.
World Bank: Transitioning to a Circular Economy (2022)
Municipal solid waste —waste generated mainly from residential and commercial sources— has emerged as one of the most pressing challenges across the world, with growing public health, environmental, social, and economic costs. By 2050, fast-growing large-and medium-size cities will nearly double the waste generation in lower-middle-income countries and upper-middle-income countries. Low-income countries (LICs), where most waste is disposed of in open dumps, are on a trajectory to triple their municipal solid waste generation by 2050. Historically, the causes and effects of municipal solid waste were considered local or regional. However, with increasing volumes and changing waste composition, municipal solid waste has become a global challenge. The waste hierarchy and the circular economy are sustainable alternatives to the traditional linear (take-make-dispose) economic model. The traditional economic model approaches the waste value chain as a linear sequence in which resources are extracted from the environment (take), manufactured into goods (make), and discarded when they are no longer needed or wanted (dispose). The waste hierarchy approach lays out a more nuanced but still linear set of disposal options and establishes a ranking among them from most to least preferable. Waste prevention and reuse are the most preferred options, followed by recycling, then recovery (for example, composting and waste to energy); waste disposal through landfills should be the very last resort. The circular economy approach closes the loop in relation to extraction, manufacturing, and disposal by advocating for designing products to reduce waste, using products and materials for as long as possible, and recycling materials from end-of-life products back into the economy. An integrated approach is required to help clients move in the direction of the waste hierarchy and a circular economy. An integrated approach avoids focusing only on disposal. Instead, it includes attention to all stages of the waste hierarchy and circular economy: designing for reusability, minimizing consumption, increasing reuse, repurposing end-of-life products, encouraging recycling, maximizing recovery, and practicing sanitary disposal. Visit source. View report.
World Bank: Bridging the Gap in Solid Waste Management (2021)
The world faces unprecedent challenges in waste management. Growing populations alongside urbanization, economic development, and associated levels of consumption are accelerating waste generation at a concerning pace. By 2050, waste production will be 73 percent higher than in 2020. This increase will be mostly driven by middle-income countries in which waste generation will nearly double in the next three decades, though low- and many- high income countries will contribute significantly to the growing volume. Only 77 percent of global solid waste is collected and 33 percent of it is openly dumped. The situation in low-income countries is particularly alarming, where only 40 percent of the generated waste is collected and 93 percent is dumped or improperly managed. The extraordinarily large quantities of waste that either go unmanaged or are inadequately managed, and the increasingly higher quantities of waste generated globally gives a serious reason for concern. Namely, global improvements in waste management practices at their current speed will likely not be sufficient to offset the adverse impact of poorly managed waste. In a business-as-usual-scenario, the gap between the waste that is currently generated and the waste that is managed properly will widen further based on the projected growth in waste generation. There are serious repercussions of the growing waste burden. Poorly managed waste poses threats to both the environment and human health. It hinders human development and economic activity, serving as a barrier to national and local governments’ ambitious goals for prosperity. Beyond significant local impacts, inadequately managed municipal solid waste is a major source of marine litter and contributes to greenhouse gases. Marine pollution and greenhouse gas emissions from the uncontrolled burning and disposal of municipal waste are now increasingly seen as major intruders on global public goods…Without a dramatic improvement in waste collection coverage and waste recovery and disposal practices, the scale of current environmental impacts will increase markedly. Visit source. View report.
World Bank: Addressing Food Loss and Waste: A Global Problem with Local Solutions (2020)
This report focuses on the role that food loss and waste (FLW) could play in reducing the environmental footprint of food systems while attempting to meet the caloric and nutrient needs of a population expected to increase by 3 billion people in the next 30 years. The performance of the global food system over the last century has been extraordinary. From a global population of 1.6 billion people in 1900 to nearly 8 billion in 2020, the agri-food sector has risen to the challenge of providing global caloric sufficiency, mainly by increasing yields of a few principal staple crops. However, this path is no longer sustainable. The success of food systems has not been without costs. Notwithstanding the extraordinary success during the past century in making food more accessible, affordable and safe, food systems have contributed to unsustainable land use practices, depletion of fresh water, pollution from chemicals, disruption of nitrogen and phosphorus cycles, biodiversity loss, and climate change. The world is transgressing key planetary boundaries, in part due to food systems that are endangering the environment while still failing to fulfill the caloric and nutrient needs of a large population. Approximately 678 million people around the world (FAO et al. 2020) still go hungry every day, and one in three is malnourished. The pressures will continue to increase. In the next three decades, we will need a 30-70 percent increase in food availability to meet the demand for food by an increasingly large, urbanized and affluent population. However, the evidence is clear that today’s global food and land use system is already failing on multiple fronts, from persistent undernourishment and hunger in certain pockets of the world to the global depletion of natural resources and immense carbon dioxide emissions, all while a large number of poor farmers are excluded from the wealth created by food systems. Business as usual will not be good enough. Only a transformation of the global food system will ensure that the world is not worse off in the future. While food systems generate an unsustainable environmental footprint, the amount of food lost or wasted is, according to some estimates, about 30 percent of the total world food supply. Advocates of food systems transformation increasingly see reducing FLW as a promising strategy for helping feed the planet while reducing the associated environmental footprint. Visit source. View report.
World Bank: What a Waste 2.0 (2018)
The world generates 0.74 kilogram of waste per capita per day, yet national waste generation rates fluctuate widely from 0.11 to 4.54 kilograms per capita per day. Waste generation volumes are generally correlated with income levels and urbanization rates. An estimated 2.01 billion tonnes of municipal solid waste were generated in 2016, and this number is expected to grow to 3.40 billion tonnes by 2050 under a business-as-usual scenario. The total quantity of waste generated in low-income countries is expected to increase by more than three times by 2050. Currently, the East Asia and Pacific region is generating most of the world’s waste, at 23 percent, and the Middle East and North Africa region is producing the least in absolute terms, at 6 percent. However, waste is growing the fastest in Sub-Saharan Africa, South Asia, and the Middle East North Africa regions, where, by 2050, total waste generated is expected to approximately triple, double, and double, respectively…Globally, about 37 percent of waste is disposed of in some type of landfill, 33 percent is openly dumped, 19 percent undergoes materials recovery through recycling and composting, and 11 percent is treated through modern incineration. Adequate waste disposal or treatment using controlled landfills or more stringently operated facilities is almost exclusively the domain of high-and upper-middle-income countries. Lower-income countries generally rely on open dumping—93 percent of waste is dumped in low-income countries and only 2 percent in high-income countries. Upper-middle-income countries practice the highest percentage of landfilling, at 54 percent. This rate decreases in high-income countries to 39 percent, where 35 percent of waste is diverted to recycling and composting and 22 percent to incineration Visit source. View report.
Why And Pollution? To study the issues:
|
|
Nutrient
|
|
Air
|
|
Freshwater
|
|
Chemical
|
|
Plastic
|
|
|
Marine
|
|
E-Waste |
|
Soil
|
|
Greenhouse
|
|
Solid
|